

As a digital marketer, you know that data is the backbone of your strategies and campaigns. It’s the fuel that drives your decisions, helps you understand your audience, and guides your optimization efforts. But let’s face it: raw data alone often doesn’t tell the whole story.
But by transforming data into appealing and insightful reports, you can:
In short, digital marketing reports bridge raw data and actionable insights. And with the right tools and processes in place, creating these reports doesn’t have to be time-consuming or tedious. In this beginner’s guide, we’ll show you how to create digital marketing reports that impress and get real results.
Effortlessly export your Google Docs to WordPress with just 1-click.
Get Started Today
Before diving into the data, take a step back and consider who your report is for. Is it your boss, a client, or your marketing team? Understanding your audience is important. It helps you determine the key metrics and KPIs that matter most to them and align your report objectives with their business goals.
When identifying the right KPIs, consider the specific marketing channels and campaigns. Do you want to increase sales, get engagement, raise awareness, or get email addresses? This will impact the KPIs you select.
Here are some common scenarios and the KPIs you might want to track:
If you’re running social media campaigns, focus on KPIs such as:
For email marketing campaigns, track KPIs such as:
If you’re focusing on content marketing, track KPIs such as:
For paid advertising campaigns, such as Google Ads or Facebook Ads, track KPIs such as:
Marketers can efficiently monitor these metrics through a Google Ads dashboard that provides real-time insights into campaign performance. When creating a digital marketing report, it’s tempting to include every metric under the sun. After all, you want to show the full impact of your efforts. But here’s the thing: sometimes, less is more! Some vanity metrics, like social media followers or page views, look impressive but don’t impact your bottom line.
Your goal as a marketer is to distill all the data into a clear, concise report that tells a compelling story.
Pro Tip: If you need clarification on what your stakeholders want to see, ask! Setting up a quick meeting or sending a brief survey can save you time and money.
Now that you’ve identified your target audience and the KPIs you want to track, it’s time to gather the relevant data. This matters because the quality and accuracy of your data directly affect the insights and recommendations you get from your report. This typically involves three essential steps:
Which platforms and tools contain the data you need to track those metrics? Some common data sources include:
When working with platforms like Google Analytics or Google Ads, having a Google certification can be beneficial. It ensures you’re well-versed in using these tools effectively, which can lead to more accurate data collection and interpretation for your reports.
Also, having a solid content management system (CMS) in place can make a significant difference when gathering and organizing your marketing data. Many marketers are now exploring newer CMS options that offer more flexibility and ease of use. If you’re in the market for a new CMS, it’s worth researching to find one that aligns with your data collection and management needs.
For client-facing teams, it also helps when your report can answer the follow-up question: “Did this pipeline turn into real work?” In those cases, it’s useful to cross-check marketing results with delivery and finance basics, like billable hours, project margins, or invoicing status, using ERP systems built for organizations. That extra layer of context keeps your reporting grounded in how the business actually runs, not just what happened in ad dashboards

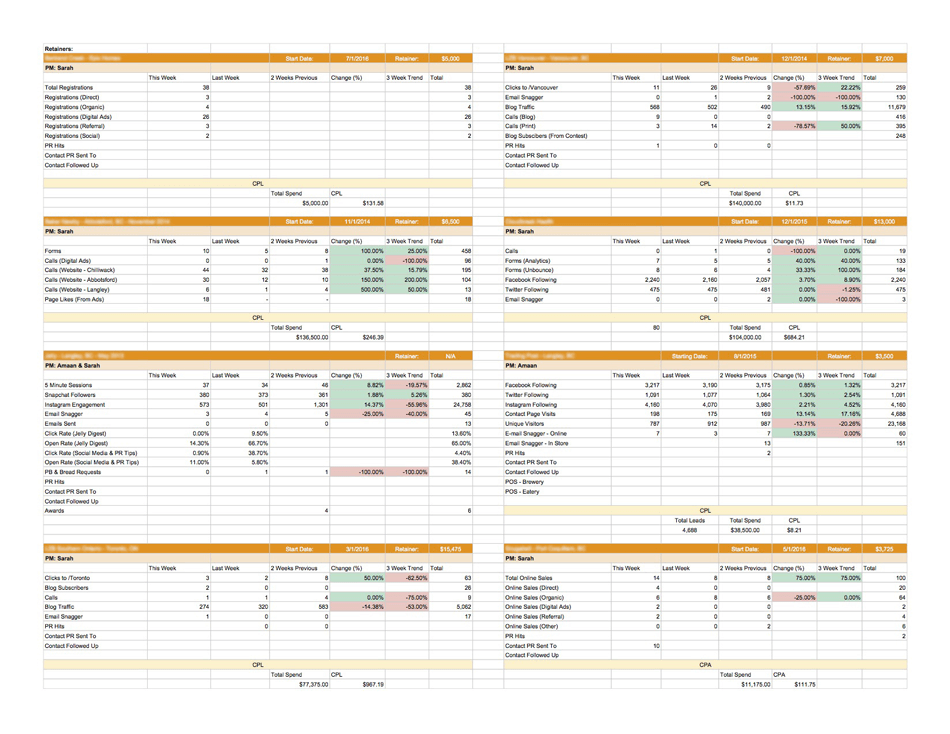
(Image Source: DashThis)
Collecting data from each platform is crucial for a comprehensive marketing report. Depending on the number of platforms you use and the volume of data you need to collect, this can be a time-consuming and complex task. You may need to export data from each platform manually, ensure that the data is in a compatible format, and then combine it into a single Google sheet or database.
To simplify data management, tools like Google Workspace can help centralize your efforts into one platform. You can review Google Workspace pricing to find the plan that best matches your team’s needs, whether you’re working with a small team or managing a larger one.
You may need to export data from each platform manually, ensure that the data is in a compatible format, and then combine it into a single Google sheet, database, or even an expense tracker if your report includes financial performance metrics.
To automate the collection of public web data for these reports, using a tool like HasData’s web scraping API can significantly reduce manual effort.
This process can lead to inconsistencies and errors, especially when dealing with large amounts of data from multiple sources. However, by consolidating your data into a central location you streamline management processes, gain a more holistic view of your marketing performance and make decisions based on a single source of truth.
For marketers juggling multiple platforms and data streams, the real challenge isn’t just in collecting the data, but ensuring it’s accurate, up-to-date, and accessible in one place without hours of manual labor. That’s where automation tools make a real difference.
One simple way to streamline this process is by using the Coefficient data connector, which lets you sync live data from platforms like Google Ads, HubSpot, and Facebook directly into Google Sheets or Excel. This helps reduce manual effort, minimize data errors, and keep your reports consistently up to date.
You’ll also need to clean and process the data to ensure accuracy and consistency. This involves tasks like:
Pro Tip: Tools like DashThis can simplify this process by automatically integrating with your various data sources and pulling the data into a centralized platform.
With your data tidied up, it’s time to put on your analyst hat and start exploring. Look for patterns, trends, and anomalies that can help you answer questions like:
As you examine the data more closely, note any emerging insights or recommendations. These will be the key takeaways you highlight in your report. For example, a sudden drop in Return on Ad Spend (ROAS) might indicate an issue with ad targeting or creative performance—insights like these can directly influence your next campaign decisions.
Using marketing mix modeling, as outlined by Sellforte, can provide deeper insights into how each marketing channel contributes to overall performance. This approach helps quantify the impact of different campaigns, allowing you to make data-driven decisions on budget allocation. By combining these insights with your KPI analysis, you can optimize marketing efforts for maximum return.
Identifying trends is just the first step. How you translate them into actionable insights that drive meaningful decisions is what truly matters. By understanding which patterns impact performance the most, you can refine your strategies and maximize results.
Pro tip: DashThis’ comment feature allows you to provide additional context.
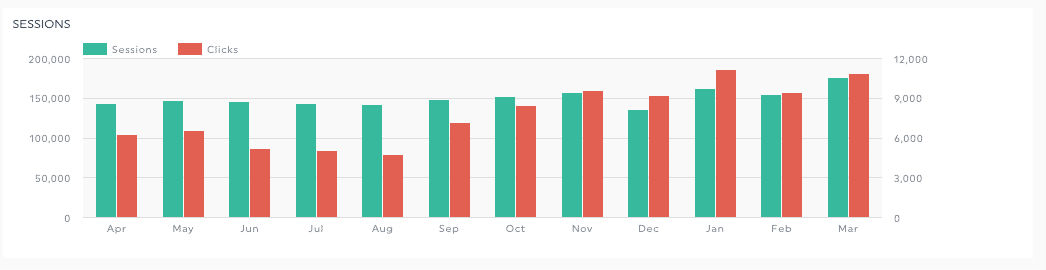
You’ve got your insights, but how do you present them in a way that’s engaging and easy to understand? That’s where data visualization comes in! Using charts, graphs, and other visuals, you can make data easier to understand and highlight key trends. You can do this with an Excel spreadsheet or other tools you create or quickly build great performance reports with DashThis.
Using AI tools like a bar graph generator will help you quickly create data visualizations, making your reports more engaging and easy to understand.
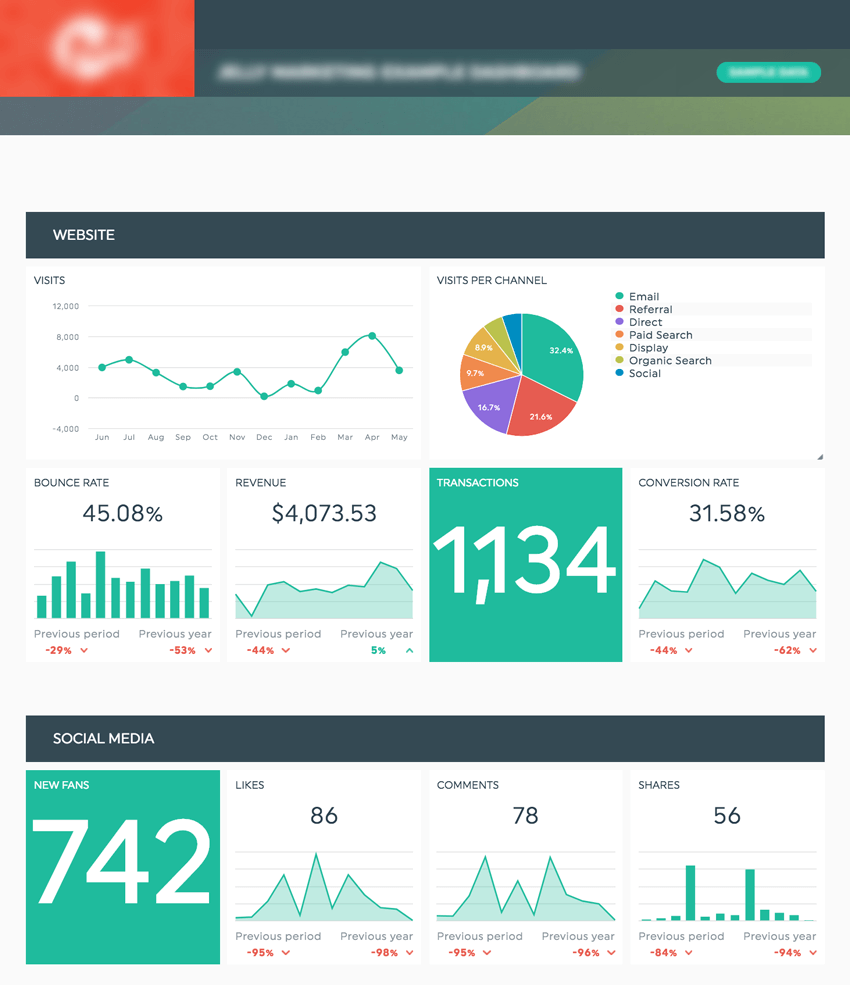
DashThis screenshot provided by Author
Now that you’ve gathered, cleaned, and analyzed your data, it’s time to create your marketing report. This is where you’ll pull all your insights together and present them clearly and visually in a way that tells a compelling story.
There are several ways to create a marketing report, each with pros and cons. Let’s take a look at a few options:
One option is manually creating your report using a spreadsheet tool like Microsoft Excel. With Excel, you can:
Excel is powerful, but manual report creation can be time-consuming and error-prone.
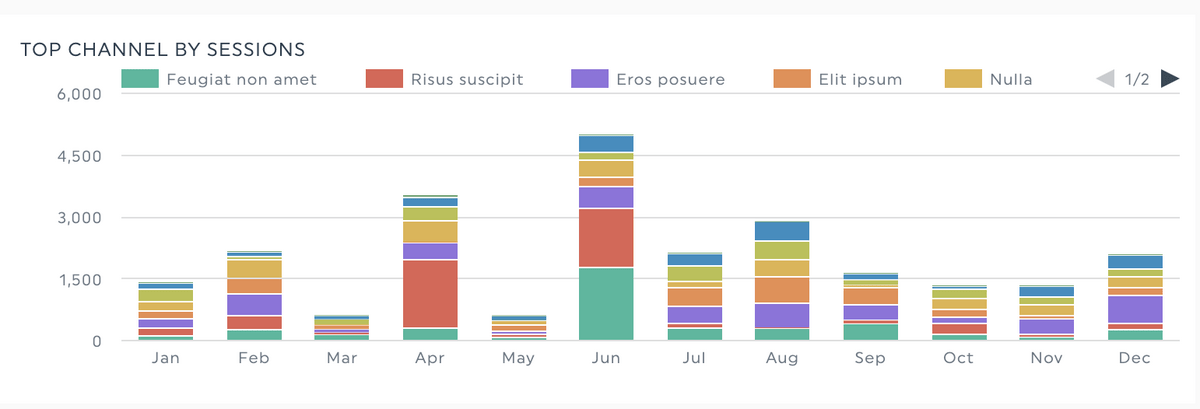
DashThis screenshot provided by Author
Google Docs is versatile for creating brochures, and when paired with tools that let you create an interface with Google Sheets, your data-driven brochures become even more dynamic.
Another option is to use a data visualization tool like Google Data Studio or BlazeSQL. These tools allow you to:
Data visualization tools can speed up and make the report creation process more intuitive, but they may need more customization and automation. For more complex and dynamic reporting needs, advanced tools like Power BI offer enhanced capabilities. Power BI allows you to build sophisticated dashboards, integrate multiple data sources, and automate reporting processes. If you require deeper insights or more tailored reporting, working with Power BI developers can further optimize the setup, ensuring your reports are both powerful and efficient.
Engineering-led teams that prefer building custom reporting apps can use .NET UI components for WinForms and WPF to create interactive dashboards with data grids, charts, pivot tables, and Excel/PDF export. This gives you full control over performance, branding, and deployment while aligning dashboards to the exact KPIs and stakeholder needs you defined.
For a more automated approach to reporting, consider using a reporting tool like DashThis. With DashThis, you can:
Creating a report in DashThis is simple and intuitive. Just follow these steps:
DashThis screenshot provided by Author
An automated reporting tool like DashThis saves time and effort while creating more professional, engaging, and actionable reports. By presenting your data clearly and visually compellingly and providing actionable recommendations, you can help your team make better decisions and optimize your marketing strategy for success.
Congratulations, you’ve created an awesome digital marketing report! But, to maximize the impact of your report, you’ll want to:
Finding the right reporting frequency is crucial when creating marketing reports. While weekly reports can help you stay on top of short-term trends, they may need to provide more data to identify meaningful patterns. On the other hand, yearly reports can offer a high-level overview of your marketing performance, but they may need to be more timely to help you make proactive decisions throughout the year.
This is where monthly reports strike a balance. Reviewing your key performance indicators (KPIs) and marketing analytics every month, you can comprehensively understand your progress, identify trends and opportunities, and promptly make data-driven adjustments to your strategy. Tools like an AI Research Assistant can further streamline this process by surfacing relevant market intelligence and help teams focus on strategic insights.
Creating effective digital marketing reports may seem daunting initially, and according to CDP.com, 57% of marketers don’t feel equipped to get the most out of their marketing data.
But by following these six steps you’ll turn data into actionable insights that drive results. Focus on your stakeholders’ needs, highlight the important data, and present your results clearly.
So, what are you waiting for? Start building those reports and watch your marketing efforts rise to new heights!