


Many teams publish more blog posts, landing pages, and emails every month. Yet they still struggle to connect that output to content marketing ROI. Traffic numbers may rise. But leads, conversions, and revenue remain the same.
Part of the problem comes from tracking only vanity metrics. Pageviews and impressions can look good in reports. But they rarely show whether your content strategy aligns with your business goals.
Strong content team metrics give content managers a clearer view of both content performance and production. They connect audience engagement, workflow efficiency, publishing speed, and revenue impact.
The right content metrics also help teams:
In this article, we discuss the metrics that every content manager should track.
Highlights
Content Marketing Institute’s 2025 research found that 43% of B2B marketers struggle to stand out from competitors. That makes choosing the right KPIs even more important: teams need to know which content is actually helping them compete, not just which pages are getting views.
That’s one reason strong key performance indicators help. Teams need metrics tied to business impact and content quality, not just publishing volume.
A high-traffic page doesn’t always mean that your content is performing well. A blog post may generate thousands of visits. But it may fail to produce qualified leads.
Metrics like impressions, raw traffic, and follower counts do not prove business growth on their own. They don’t show your visitors’ actions.
Imagine a blog post about content planning gets shared widely on LinkedIn. It may drive a traffic spike. However, if visitors leave without subscribing, requesting a demo, or downloading a resource, that traffic may not be doing much for your brand.
Useful KPIs connect daily work to business goals. As a content manager, you should track:
These metrics help you see if your content strategy supports revenue and long-term growth.
Different teams also track different outcomes. SaaS companies may focus on demo requests. However, publishers often track subscriber growth and returning readers.
Traffic data helps you understand if your SEO content strategy is attracting the right audience, which is crucial for measuring the effectiveness of your digital marketing efforts. Visibility metrics also show which content types support long-term growth and future content planning.
Organic traffic measures the number of visits from search engines. Steady growth often shows that your content’s performance improves over time. It can also signal stronger keyword coverage and better search visibility.
You should also compare new visitors and returning visitors. This allows you to measure the effectiveness of different content strategies. Consider a blog that attracts repeat readers. It may show stronger audience trust than one-time traffic spikes.
Raw traffic numbers can create a false picture. One user may visit the same page multiple times. This increases total clicks. But unique users measure the real audience size behind the traffic.
Engaged sessions show whether users interact with the content. Visitors who read multiple pages or stay longer often indicate stronger user engagement than those with short visits.
Strong performance metrics go beyond rankings alone. You can track:
These numbers help you understand whether your pages are appearing to the right audience.
For example, rising impressions with low clicks may signal weak titles or meta descriptions. These insights also support smarter keyword targeting.
Different types of content often drive different results.
Compare the performance of your content pages. These include:
For example, templates may drive more qualified leads even if they attract less overall traffic.
High traffic has limited value if people leave before engaging with the page. You also need to know whether readers are staying, scrolling, clicking, and finding enough value to keep moving through your content.
Track the following metrics:
Average time on page measures how long visitors stay on a page before leaving. A longer session can suggest that your content is engaging, relevant, or easy to follow.
Still, long sessions aren’t always a positive sign. For example, users may spend extra time on a page because the information feels confusing or difficult to scan.
This is the formula you can use:

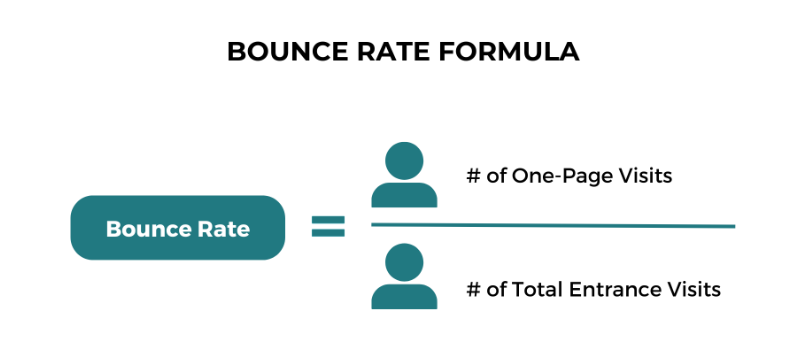
Bounce rate is another important metric. It tracks visitors who leave after viewing one page. Exit rate shows where users leave the site during their session. Both metrics provide useful signals. However, context is important.
Let’s say you spot a high bounce rate on a specific page. It may still perform well if visitors finish reading the article before leaving the site.
To calculate the bounce rate, use this formula:
Scroll depth is a metric that can help you understand whether visitors are reading the full piece of content or leaving halfway through. It can reveal weak sections, poor formatting, or content that loses reader interest.
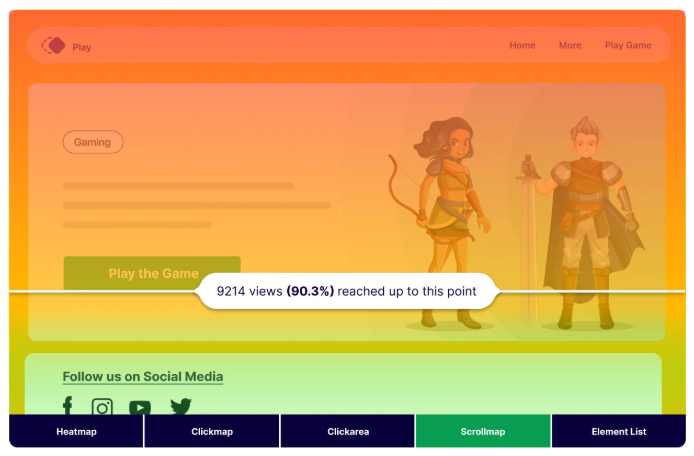
If most users stop scrolling before the conclusion, your content writers may need to shorten sections or improve content flow.
These metrics help content marketers measure how audiences respond to content distribution. You often track:
Mailchimp’s report puts the average email open rate at around 34.23%. This gives you a useful benchmark for email marketing performance. If your emails have a low click-through rate, check the subject line, CTA, audience fit, and linked content before assuming the article itself is the problem.
Traffic and engagement only show part of the picture. Conversion metrics help you understand if your content strategy efforts support lead generation, pipeline growth, revenue goals, and content marketing ROI.
Conversion rate is a metric that indicates the percentage of visitors who complete a desired action after viewing a page or content asset. This can include:
For instance, a comparison page may attract less traffic than a blog post but still produce far more conversions. Visitors on these pages are usually closer to a buying decision, so a smaller audience can still create stronger business results.
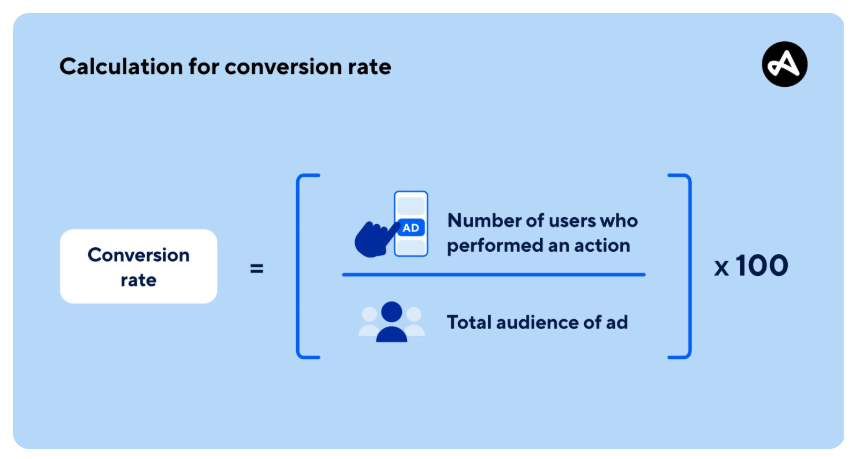
High traffic without qualified leads often creates reporting problems. Large visitor numbers don’t matter if the content doesn’t support sales goals or business growth.
Track which content assets produce form fills, demo requests, sales-qualified leads, or other actions your sales team can actually use.
For example, a blog post on Medium SEO may generate plenty of clicks, but only a few leads the sales team can use. That gap matters because the article may appear successful in a traffic report yet still fail to meet revenue goals.
Content doesn’t always drive instant conversions. In many cases, users interact with several content pieces before they take action. As a content manager, track assisted conversions and multi-touch attribution to see how earlier content touches influence later actions.
For example, a visitor may read a blog post and attend a webinar. Weeks later, they may request a demo. Another buyer may visit a comparison page before booking a sales call.
Pipeline and revenue attribution help you connect content marketing metrics to business results. Attribution models show which content pieces influenced conversions across the buyer journey.
Consider a thought leadership article as an example. It may not generate many leads. Still, it can support long sales cycles by building trust before prospects request demos or speak with the sales team.

Many teams focus on traffic and conversions but ignore what happens behind the scenes. Production metrics help you understand how work moves through the pipeline. They also signal where delays are slowing content output.
Production velocity measures how many approved content assets move from brief to publication within a set period. Track it alongside revision cycles, content quality, and conversion results so speed does not become the only measure of team performance.
This metric tells you how long it takes for content to move from draft to live publication. Slow timelines can:
If a blog post sits in review for weeks, you may miss important publishing windows or search opportunities.
Too many revisions can slow content production and create confusion across teams. Unclear approval workflows often lead to:
For example, a writer may receive separate feedback from editors, SEO teams, and content managers. That process can stretch one article across several review cycles before publication.
Production cost per asset helps teams understand ROI beyond traffic numbers alone. Content expenses can include:
For example, a downloadable template may cost more to produce than a short blog post. Still, it may generate more qualified leads and stronger long-term value for the business.
Workflow automation metrics track time saved through automation tools and publishing systems. These metrics help you understand where workflows are improving efficiency and reducing manual tasks.
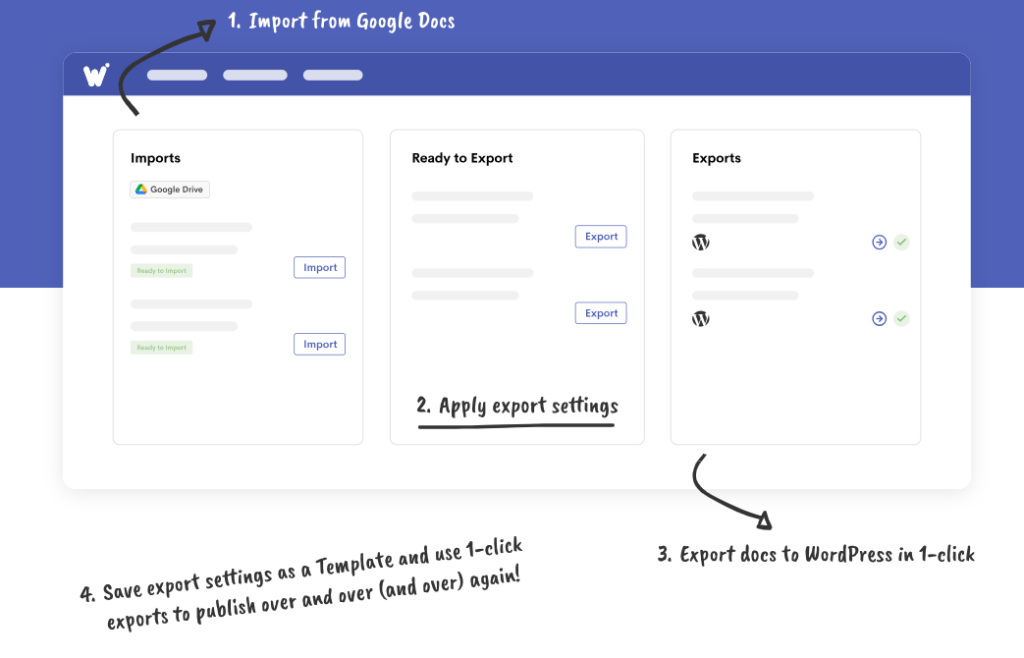
For example, CMS integrations, scheduling tools, and publishing automation can cut formatting delays. A tool like Wordable lets you upload Google Docs to WordPress instantly with fewer upload and styling issues.
A KPI dashboard should help you make faster and better decisions. It should focus on clear business goals, useful reporting, and content team metrics that you can act on.
Too many metrics can make reporting harder to understand. Large dashboards often distract teams from the numbers tied to actual business goals and content outcomes.
For example, your team may spend hours tracking impressions and clicks. But they may ignore conversion rates or publishing delays that affect performance.
A useful dashboard should answer three questions: what is working, what is blocked, and what needs action this week. That keeps reporting tied to decisions instead of turning the dashboard into another list of numbers.
Strategic metrics track long-term business outcomes. These include pipeline growth, qualified leads, and ROI. Operational metrics focus on how content moves through the workflow each day or week.
Someone may review revenue impact every month. They may also track time to publish, production velocity, and workflow delays during weekly operations meetings.
Different reporting tools track different parts of the content process. You can measure traffic and engagement by using Google Analytics. You can also track keyword visibility in Google Search Console.
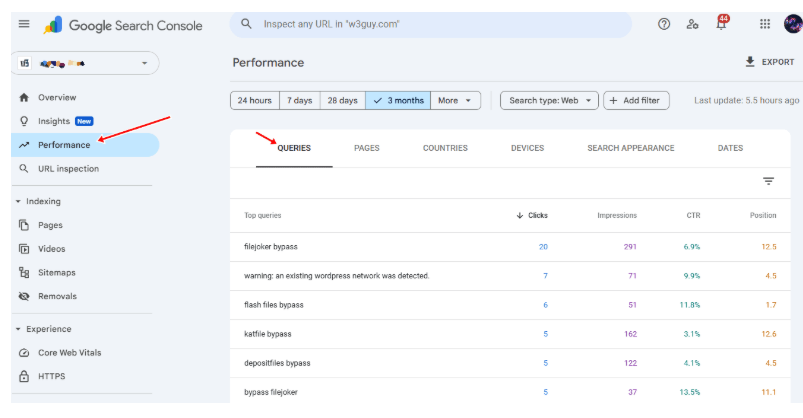
CRM platforms can also connect content to leads and revenue outcomes. Marketing automation platforms and workflow tools help you monitor publishing schedules, campaign activity, and content operations.
Review KPIs on a consistent schedule. Don’t wait for traffic to drop or for campaign problems. Regular reviews help you spot trends, workflow bottlenecks, and performance gaps before they escalate.
For example, as a content manager, you may hold weekly operational reviews, monthly performance reviews, and quarterly strategy sessions. These help you evaluate both content output and business results.
Effective content team metrics should measure more than traffic alone. Strong KPI tracking helps you understand engagement, conversions, workflow efficiency, and ROI across the full content process.
Vanity metrics can make reports look impressive without showing real business impact. Useful KPIs tell a clearer story. They show:
Strong workflows also help you improve your content and scale production with less manual work. Faster publishing systems reduce delays, simplify formatting tasks, and help content move from draft to the publishing phase with fewer problems.
Is your team spending too much time fixing formatting issues and manual uploads? Try Wordable to streamline your document-to-CMS workflow. Make content publishing faster and easier.
Content team metrics track how well your content performs across traffic, engagement, conversions, and workflow efficiency. They also track:
These KPIs help you understand if your content marketing strategy supports business goals and audience growth.
Most teams should start with organic traffic, conversion rates, qualified leads, engagement metrics, and time to publish. These KPIs give a clearer picture of both content performance and production efficiency.
Vanity metrics such as impressions or follower counts look great. But they don’t show real business impact. High traffic doesn’t always mean strong lead generation, conversions, or revenue growth from your content.