


Serious question: What was your last content review meeting like?
How much of it was spent talking about what happened last quarter versus what you can influence next quarter?
I’m betting you mostly reviewed metrics like traffic, rankings, and backlinks, right?
No shame. That’s standard practice.
But those are lagging metrics. They tell you what’s already happened.
High-performing teams measure another set of metrics that help predict future performance. They’re called leading indicators. And your team needs to embrace them ASAP.
In this guide, I’m covering a side of content performance tracking that often gets overlooked. Bookmark it and share it with your marketing leads so you can come back to it later.
Highlights
Content performance tracking means tracking metrics to improve your content strategy.
The challenge is choosing the right ones to pay attention to. Most teams track plenty of numbers. Far fewer track the ones that tell them what to do next.
Below, I’ll cover the difference between lagging and leading indicators and why both matter. Then I’ll show you how to build a tracking system that helps you make better content decisions. 👇
Lagging indicators are metrics like organic traffic, keyword rankings, backlinks, social shares, and page views.
They’re helpful for tracking how your content has performed and the results it’s generating.
The downside? They only tell you if your content worked after it’s already live. By then, there’s little you can do to change the outcome.
Want better results for your team or your clients? Then you also need to track leading indicators.
Unlike lagging indicators, leading indicators measure the activities that influence future results.
They give you early signals. That way, you can adjust your plan before traffic, rankings, and conversions catch up.
| Metric | What it measures | How to calculate | Benchmark |
| Publishing velocity | How consistently your team publishes new content | Number of published pieces per week or month | Set a target based on your team’s capacity and maintain it consistently |
| Time-to-publish | How quickly content moves from draft to publication | Average number of days between “draft complete” and publish date | Shorter is better. Track month over month and aim to reduce delays |
| Topical coverage depth | How thoroughly your content covers important topics in your niche | (Published articles on a topic ÷ planned articles in your topic cluster) × 100 | Aim for complete coverage of your highest-priority topic clusters |
| Content-to-conversion rate by stage | How effectively content moves visitors to the next stage of the buyer journey | (Conversions ÷ visitors) × 100 for each funnel stage | Improve over your current baseline instead of chasing a universal benchmark |
Here’s a deeper look into these metrics. 👇
Publishing velocity tells you how steadily you’re putting new content out. If publishing slows down or stops, it’s harder to build momentum and see steady results. To track it, count the pieces you publish each week or month. Then compare that number to the target you set for your team.
Moving forward, you need high-quality content AT SCALE. Not low-quality content at scale.
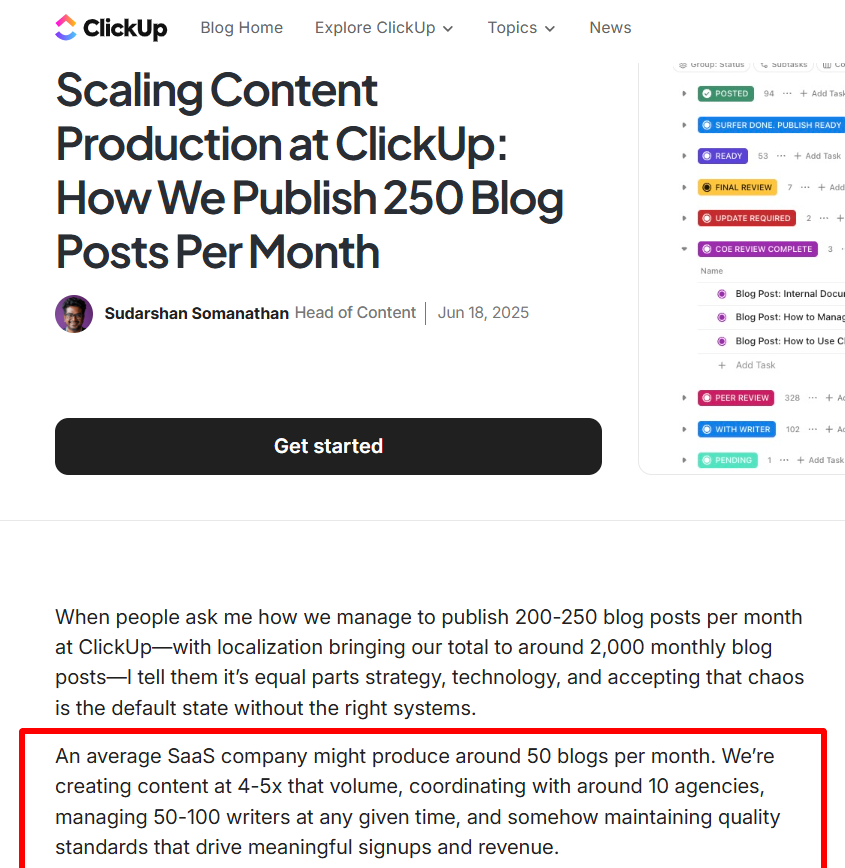
Keep in mind, you’re up against major players. For reference, ClickUp reported that it posts 250 blog posts per month. That’s roughly 4-5x the volume other SaaS companies publish on average.
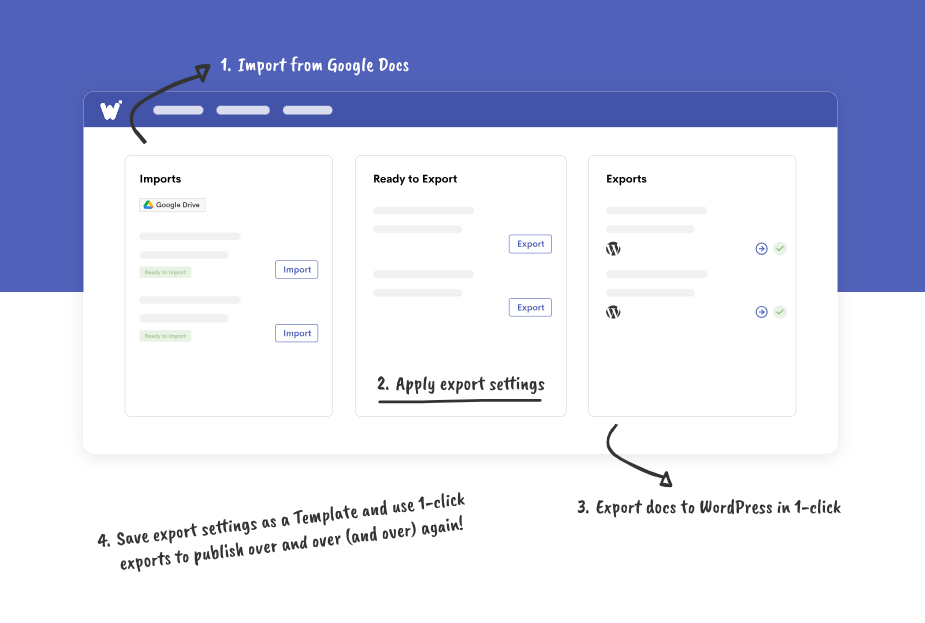
The gap between “draft complete” and “live on site” is one of the most overlooked publishing metrics. It’s also one of the easiest to control.
If content sits waiting for approvals, formatting, or uploads, it can’t start bringing in traffic or leads. Tools like Wordable help get content live faster. Like in seconds.
It takes real time to manually format and upload blog posts from Google Docs to WordPress. That’s for ONE round of batching. If you upload content by hand at scale for many clients, your team is burning valuable hours. To track this metric, log the date each draft is marked complete and the date it goes live. Then watch the average gap month over month.
Topical authority coverage looks at how complete your content clusters are. To measure it, divide the articles you’ve published on a topic by the articles you planned for that cluster.
As your clusters grow, they’re a stronger signal to search engines that your site is a trusted resource.
Review your coverage often. It helps you find missing subtopics, strengthen existing clusters, and decide what to publish next.
An easy win is targeting subtopics with lower competition. “Business credit cards” might be a beast to compete with. But “best business credit cards for small businesses” could be easy, low-hanging fruit.
BTW, our sister company uSERP helped Nav target “business credit cards,” which later generated over $140,000 per month in revenue. It was an ambitious, all-in campaign.
But, again, we also prioritize long-tail keywords that are easy to dominate.
We just recently created a cluster around these ones:
Detailed, targeted, and complete. That’s what you’re going for.
Content-to-conversion rate by funnel stage gives you an early read on your content. It shows whether each piece is moving people in the right direction.
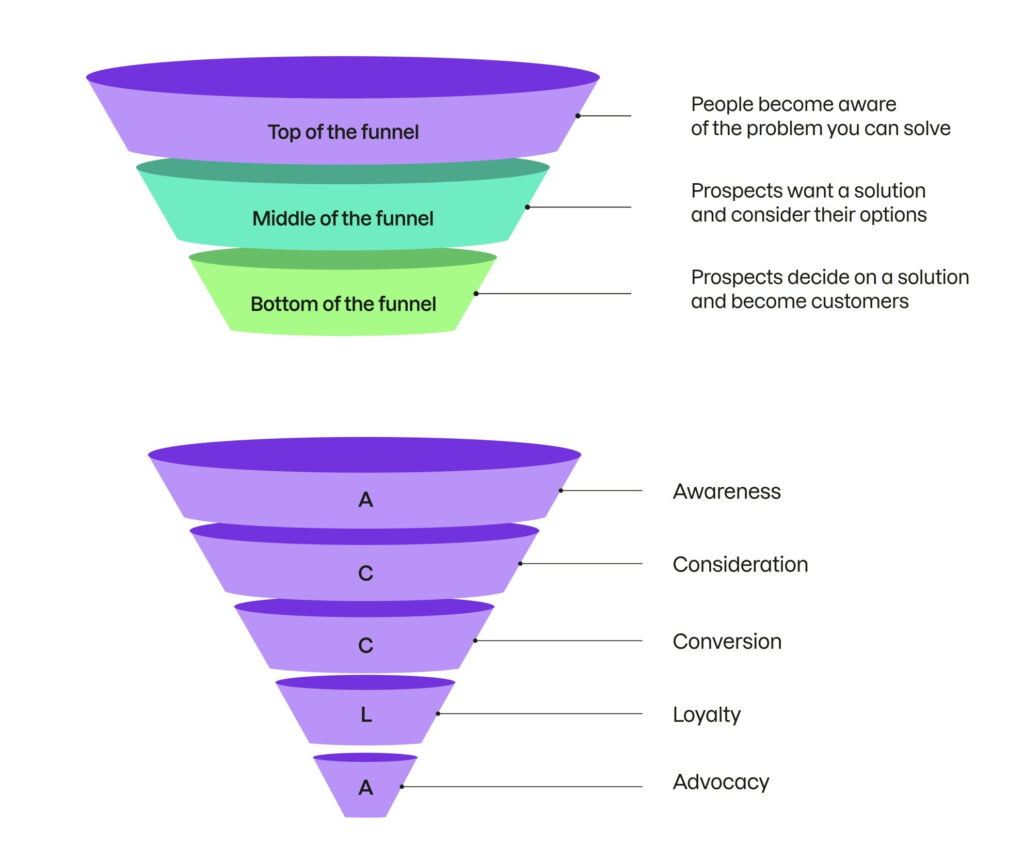
This is important because 67% of B2B buyers prefer a self-service buying experience. (Source: Gartner research.) Some content is meant to bring in new visitors. Other pieces should get people to sign up for an email list, book a demo, start a free trial, or buy something.
You want to measure each piece against the goal it was created to achieve.
For each content asset, make sure your team’s asking:
If people aren’t moving through your funnel, identify where they’re dropping off. Then fix the content, CTA, landing page, or offer that’s stopping them from taking the next step.
Here’s a quick guide on how to build a content performance tracking system that factors in lagging and leading indicators. 👇
Step 1: Define your goals. Decide what success looks like first. More traffic, better rankings, faster publishing, or more leads all require different metrics.
Step 2: Choose your metrics. Track a mix of leading and lagging indicators that align with the goals you chose in Step 1. You need metrics that show you what’s happening now AND what’s likely to happen next. For example, if your goal is faster publishing, track time-to-publish next to organic traffic.
Step 3: Pick your tools. Use tools that save you time and make tracking easier. (If you’re copying data between five spreadsheets every week, you need a better system.)
Step 4: Set a review cadence. Check your leading indicators weekly so you can catch problems early. Then review your lagging metrics every month or quarter to see how you’re progressing.
Step 5: Report and act. Don’t let your data collect digital dust. Use what you learn to improve your next piece of content, your workflow, or your overall content strategy. Share a short summary with your team so everyone knows what changed and why.
As far as content tracking tools go, you only need a handful of really good ones, like these:
| Tool | What it’s good for | Leading indicator |
| Wordable | Publish content from Google Docs to WordPress or HubSpot faster, reducing delays between writing and publishing. | Time-to-publish |
| GA4 + Google Search Console | See how people discover your content and whether they’re taking the next step. | Content-to-conversion rate by funnel stage |
| Ahrefs or Semrush | Find content gaps, build topic clusters, and track your coverage over time. | Topical authority coverage |
| Databox or Looker Studio | Monitor how much content your team publishes each week or month from one dashboard. | Publishing velocity |
Here’s how to use these tools. 👇
Time how long it takes content to move from “draft complete” to “live.”
If that number keeps creeping up, look for bottlenecks like manual formatting, approvals, or uploads.
Wordable removes one of the biggest bottlenecks. It publishes content from Google Docs to WordPress or HubSpot in a few clicks, with no manual copy-and-paste.
Use Google Search Console to see how people discover your content through search.
Then use GA4 to track what they do next (e.g., read another article, join your email list, visit a product page, or convert).
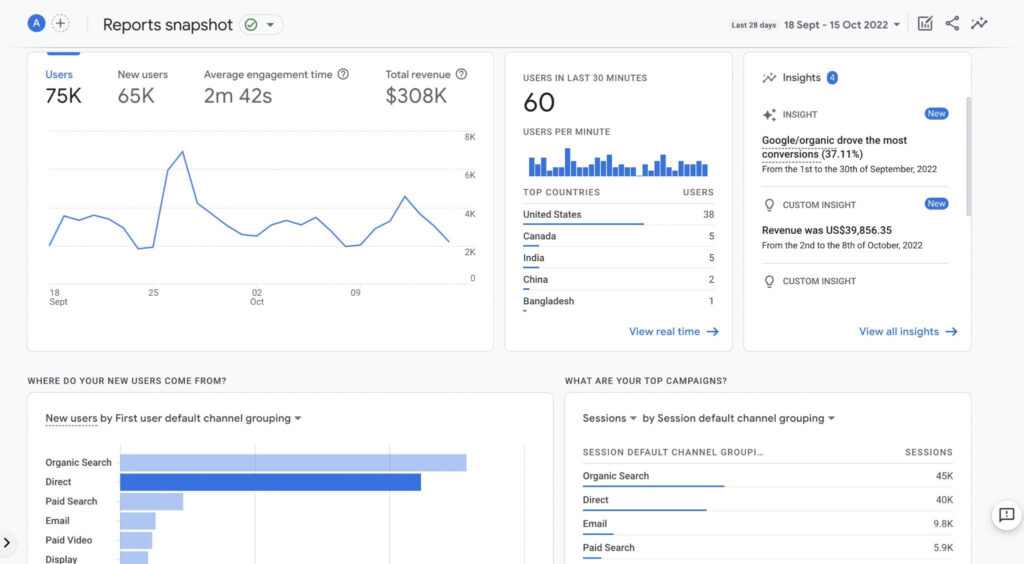
This shows you if each piece of content is doing the job it was designed to do.
Build a topical content map around your core subjects. Then use Ahrefs or Semrush to identify missing subtopics and keyword opportunities.
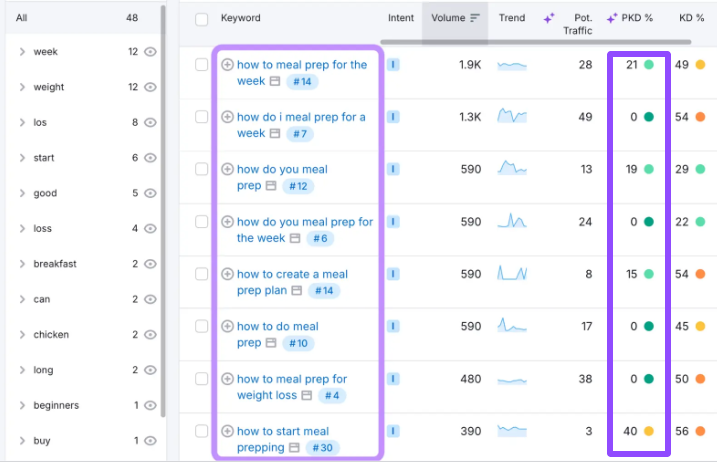
Remember to target more long-tail keywords with lower competition so you can strengthen your clusters faster.
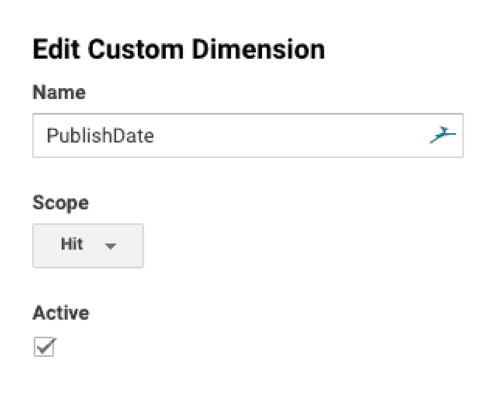
Create a dashboard that tracks how many pieces your team publishes each week or month. (If publishing starts slowing down, you’ll spot it earlier.)
Investigate whether the issue is capacity, workflow, approvals, or something else before it affects your results.
Lagging indicators still have a place. You need them to measure your content strategy’s impact.
But if they’re the only metrics your team tracks, you’ll always be reacting to results after they’ve happened.
Leading indicators help you spot problems earlier. Then you can improve your content before traffic, rankings, and conversions start moving.
Start with one or two leading indicators. Build the habit of reviewing them regularly, and expand from there.
If you need help on the publishing side, try Wordable. It saves us hours each week!
Measure content performance using a mix of leading and lagging indicators.
Leading indicators, like publishing velocity and topical authority coverage, help you improve future results.
Lagging indicators, like organic traffic and conversions, show how your content has already performed.
The right KPIs depend on your goals.
A balanced approach includes: publishing velocity, time-to-publish, topical authority coverage, content-to-conversion rate by funnel stage, organic traffic, keyword rankings, and conversions.
Review leading indicators weekly so you can catch problems early and keep projects moving.
Review lagging indicators monthly or quarterly to measure your content strategy’s long-term impact.