

Srsly.
Just stop.
❌ No, you don’t need “101” content marketing analytics.
❌ No, you don’t need “14,098,756,023-point guides” to content marketing.
❌ No, you don’t need to overcomplicate things more than they already need to be.
Remember: the hard part isn’t tracking your stuff. It’s actually creating and publishing and promoting your stuff. The doing your stuff.
So don’t overthink this. No fancy, second-by-second KPI dashboards required.
Yes, I know it’s hard. Yes, we’re going to touch on 15 different content marketing KPIs here. Yes, you should know what they are and which analytics tool to find them and how they work together.
But no, you don’t need to obsess over them all daily, either.
Here’s why.
Effortlessly export your Google Docs to WordPress with just 1-click.
Get Started Today
In reality, there are only three content marketing analytics categories to focus on:
Got it? Good.
Now, here’s the thing.
All of these numbers are meaningless on their own.
Site traffic up 200%? Bounce rates down 15%? Revenue up 40%?
Great. Good for you.
But what if site traffic SHOULD be up 500%? Bounce rates down 70%? Revenue up 112,349,032%?
The content marketing analytics we’ll discuss are all relative. Relative to:
So keep that in mind. What follows here will help lay the foundation. The groundwork. The infrastructure to build upon.
But it’s all meaningless at the end of the day. Because the hard part of your job is team building, planning, producing, and optimizing.
Your overall marketing strategy obviously guides all this work. But content marketing analytics, specifically, only exist to help you know how to do those things, better and faster, to continually squeeze out a higher ROI.
Quick.
I got a confession. Secret Time.
See, I do this whole content + SEO thing for a living. For about a decade, across several companies, hundreds of clients, and thousands of articles per year.
And yet?
I almost NEVER open up Google Analytics. Seriously. Maybe once a month if I’m forced to find something that can’t be found anywhere else.
Back in the day, I had this professor in college. Never gave our grades out. Never let us know how we were doing, or where we were trending. Never knew how many hours we had to pour over mid-term and final exams.
Of course, we called him an old cranky asshole. In fairness, he kinda was. Has probably already kicked the bucket by now.
But his point was that “we already knew how well we were doing.”
Or at least, we should — deep down — know how well we were already doing. Intuitively. Based on our level of effort and confidence and knowledge of the subject matter.
Welp, damnit, that old cranky asshole was right on the money after all.
I don’t look at Google Analytics because I don’t have to. I don’t have to. I already know how we’re doing, and where we’re trending, based on our strategy and inputs.
Here’s what I mean:
Traffic is a lagging indicator.
So weeks and weeks before it ever appears as a blip inside Google Analytics, comes the actual topic and keyword selection. Like a twinkle in your parents eye three-fourths of a year before you appeared.
From there, comes content and optimization and publishing and distribution and then, if you did all those things correctly, comes your traffic.
In other words, if you want to increase traffic, stop focusing on the output (traffic) and instead focus on the inputs (content quality, on-page optimization, topical authority, links, etc.).
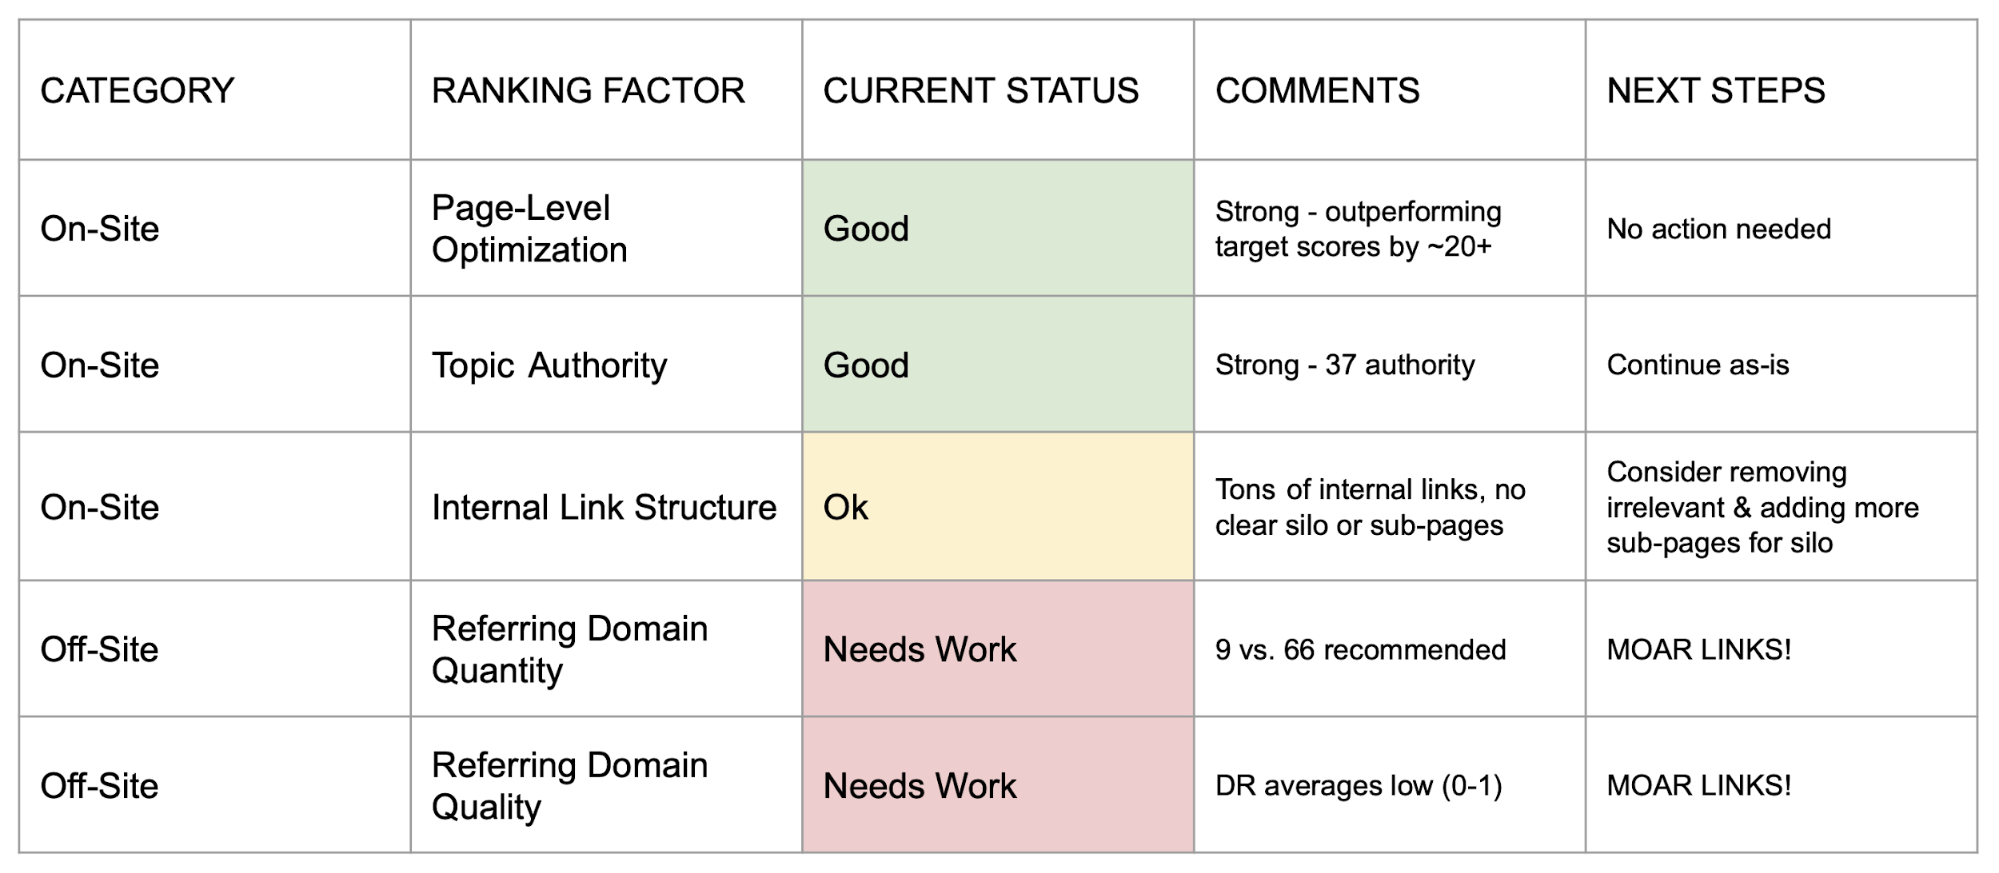
Take Exhibit A below. Create a “balanced scorecard” to analyze each piece of content on your site into a few key components.
First and foremost, don’t bring a knife to a gunfight.
All the content in the world can’t save you if you’re trying to compete on keywords that are well outside your competitive range.
Search Engine Result Pages (SERPs) are winner-take-all markets. So the old Pareto Principles applies – 80% of the results go to the top 20% ranking. The first half of the first page gets all the clicks, while the bottom half and everyone else languishing on Pages 2, 3, 4, plus, get zilch.
So. It’s better to be #1 on a smaller keyword that you can win in the next six months than it is to be #25 on a keyword it might take years to see results. (UNLESS, you have deep pockets, lots of patience, and lots of ambition.)
Diagnose this in about five seconds. Grab the top competitors ranking, look at their Domain Rating as a simple proxy, and compare to yours.
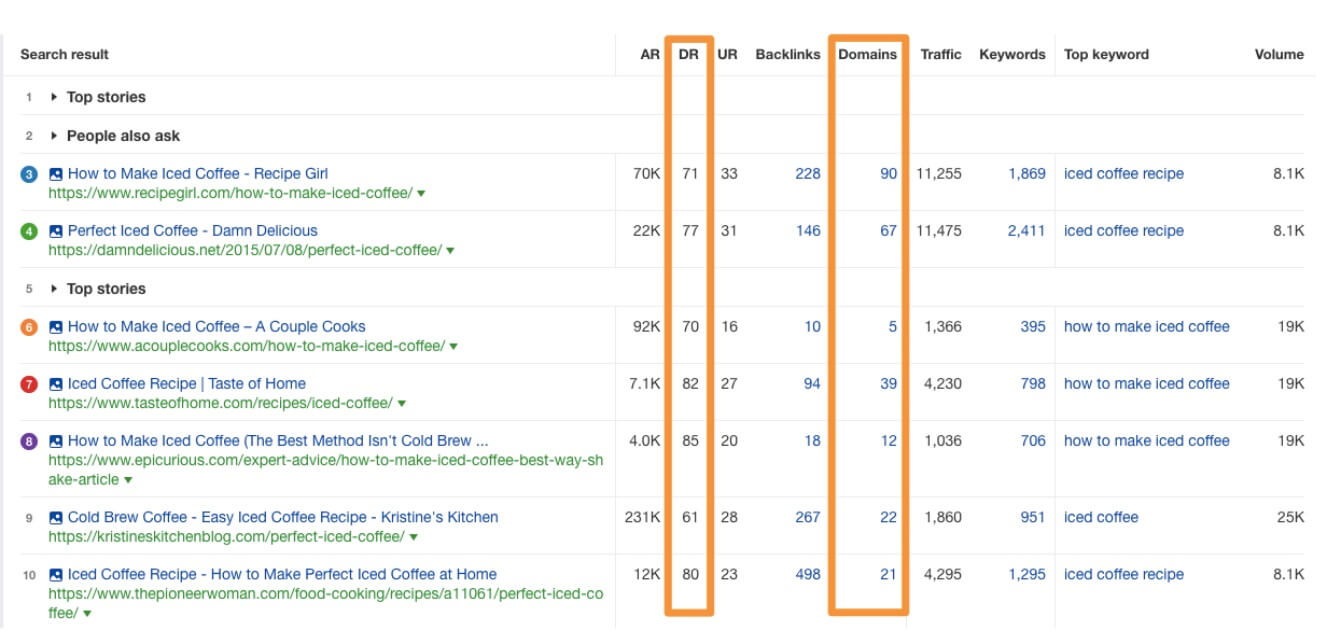
If you ain’t in the same DR ballpark, or can’t reliably drive the same number of referring domains to this page? Don’t bother.
Stop. Reset. Rank for what you can in the interim. Revisit and revise next quarter or next year.
Old school SEO’s are too one dimensional.
Yes, that “Keyword Difficulty” metric inside ahrefs helps. But only a little bit. And if you know it’s limitations.
For instance, it’s helpful from an off-site perspective – the strength of the competition already ranking and what (they think) it might take to compete.
But it’s a generic result. It doesn’t capture any of your own personalized strengths or opportunities. It also doesn’t account for on-page results like content quality or writing.
Here’s where the MarketMuse’s of the world are worth their weight in gold. You can overlay that traditional keyword research data with your website’s actual strengths and weaknesses to get personalized difficulty scores (from a content, not just link) perspective.
And it’s your site’s “topical authority” that often dictates whether you will (or won’t) rank (soon) for a keyword or topic that’s within your range.
If you’re already deemed to have “expertise” on a topic, you’re good to go. If not, it’s gonna be an uphill battle – again, no matter how many links you build or tweets you push.

The chicken or the egg?
How DO you build “topical authority” for something if you don’t have it already?
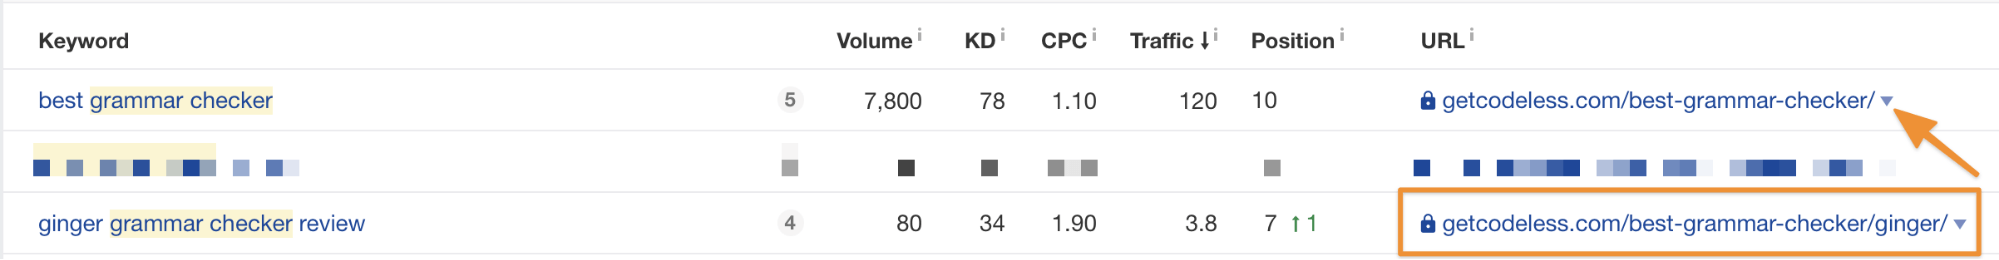
The short answer is site architecture. The longer explanation is to use hub pages and a silo structure and then lots of supporting (good!) content to build up a web of context around specific topics.
(Yes, this is basically the same as “pillars” or “clusters” or whatever shit-hot Unicorn has misappropriated these decade-old concepts that we’ve been using forever.)
Concrete example. A difficult, competitive keyword with commercial intent becomes your “hub” or “pillar” or whatever the kids are calling it these days. Then, long-tail variations become your “spokes” or “sub-pages” and what not. Then, those subordinate pages link to each other and back up to your primary page.
All we’re really talking about here is your internal linking strategy. Don’t just haphazardly create internal links. Don’t just let random writers or contractors do this for you, either.
In an ideal world, there is some actual thought process behind which pages get links from other ones, and why.
After (1) selecting a keyword you can confidently compete for, (2) making sure it falls within your site’s topical authority, and (3) you know how it’s going to be organized on your site, you can start writing.
Obviously, that’s a YUGE topic for another day. But a few things to keep in mind:
Otherwise, page-level optimization is exactly that – how well does a page’s content actually match search intent (or what people want to see when they search for this query). And how much better does it do that than the rest of the competition trying to rank for this same page?
Published content? Great!
Got some social shares? Fantastic!
Still not ranking? Not surprising!
Social media has some impact on rankings. But still not enough. And despite what substance-less “gurus” have been promising for years, links still make clink.
(You know, coins. Greenbacks.)
Quality links matter. More on that in a sec.
But you need quality and quantity to thrive today.
Simple example. If your competition has hundreds, and you sittin’ on “9”… good Fing luck!

No, you probably don’t need 10,000. But, um, yeah, you’re gonna need at least a few dozen (if not a few hundred) to crack into the top ~1-3 positions that get 80% of the clicks.
“Quality” is obvious. It’s a no brainer. Goes without saying.
But how should you think about it at scale? Because that’s ultimately the goal. Because that’s how you drive long-term, sustainable success that lasts decades. You get big, fast.
Simple aggregate metrics like “Domain Rating” have tons of limitations. But again, let’s just use them as a proxy for overall authority. Once you know what you’re doing, you can drill down into URL ratings and C-blocks and whatnot.
Again, here’s a simplistic example to illustrate the thought process. Peep the number of ~DR 60-80 referring domains to the page on the left, vs. the ones on the right.
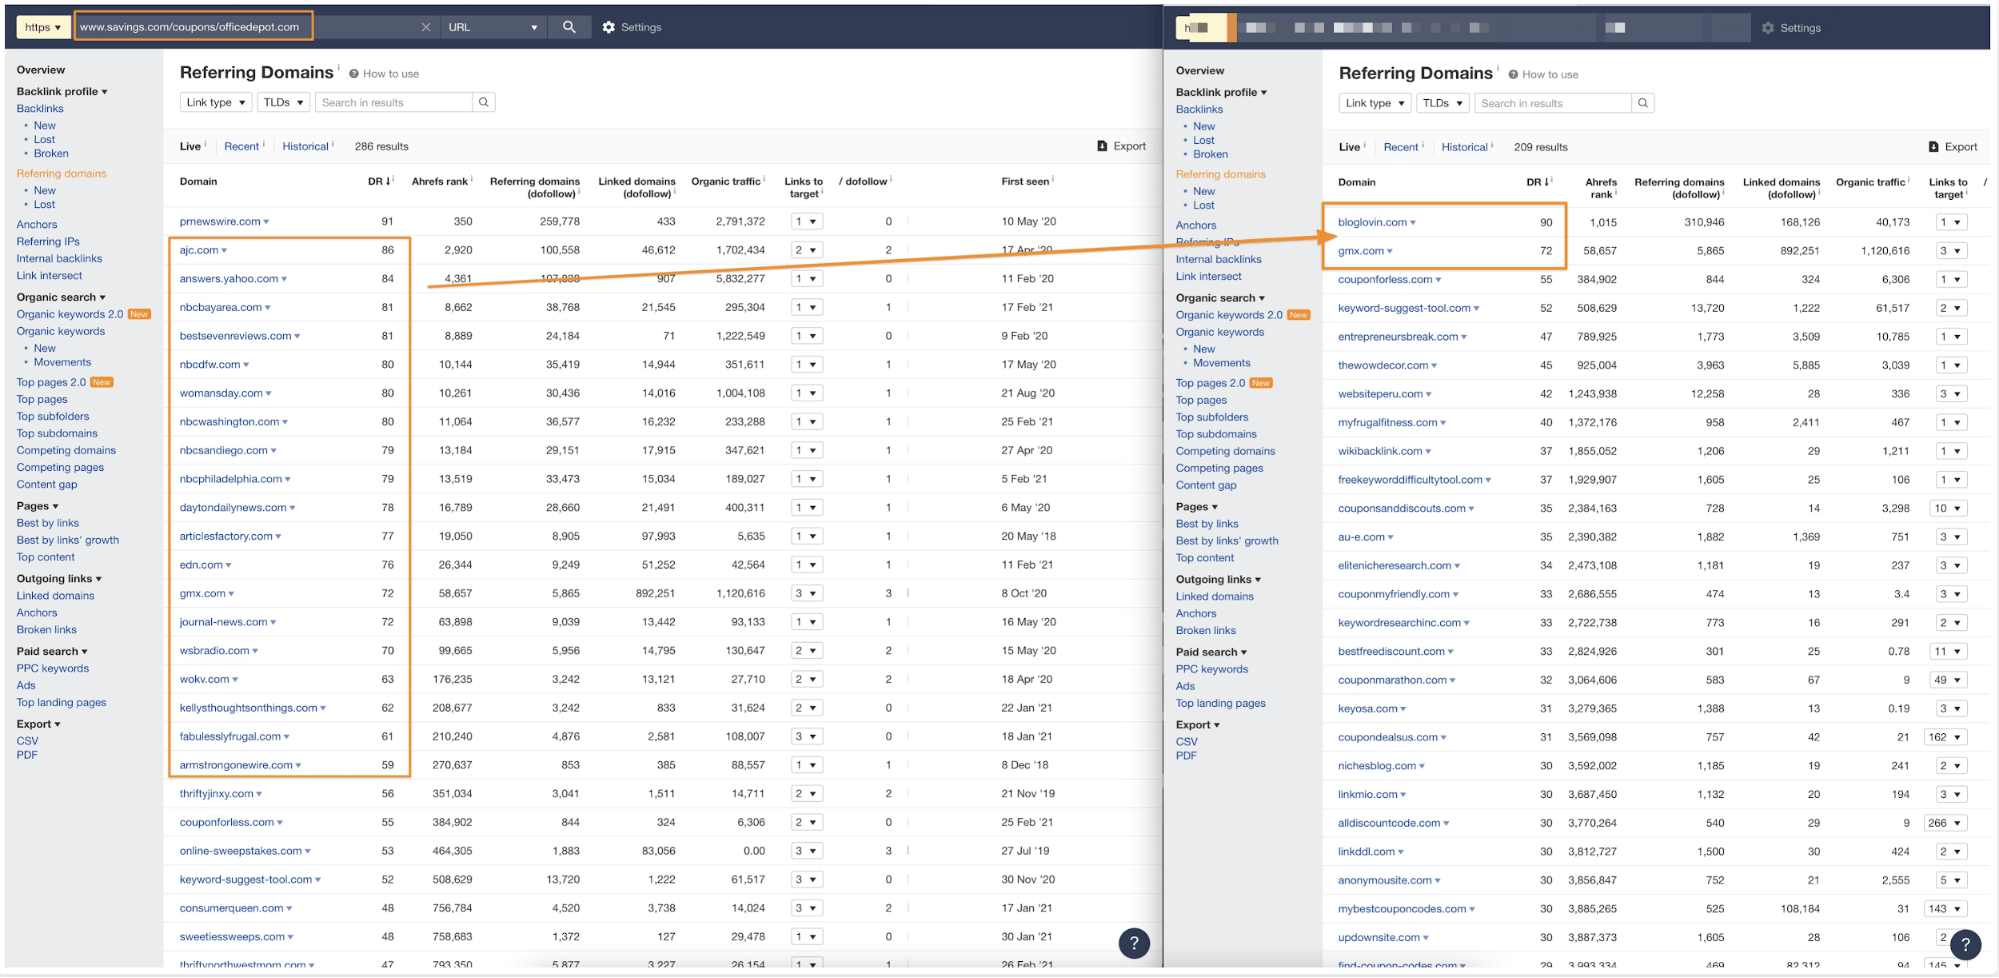
See? This is why you need both quality and quantity. This is just one page we’re focusing on. Extrapolate this out to your entire content strategy.
What’s the repeatable method you have for driving a ~dozen DR 60-80 links to ONE page of content? Then, multiply that across all the content you’re publishing on a monthly basis?
What’s that? You don’t have one yet?
Fix THAT before worrying about setting up some fancy Google Analytics dashboard, then.
Content is subjective.
“Quality content” means many things to many people.
I hate generic, flimsy, opinion-less drivel. Yet, others don’t want different writers to sound different and don’t want to offend anyone and don’t want to ever take sides.
No one’s right. No one’s wrong.
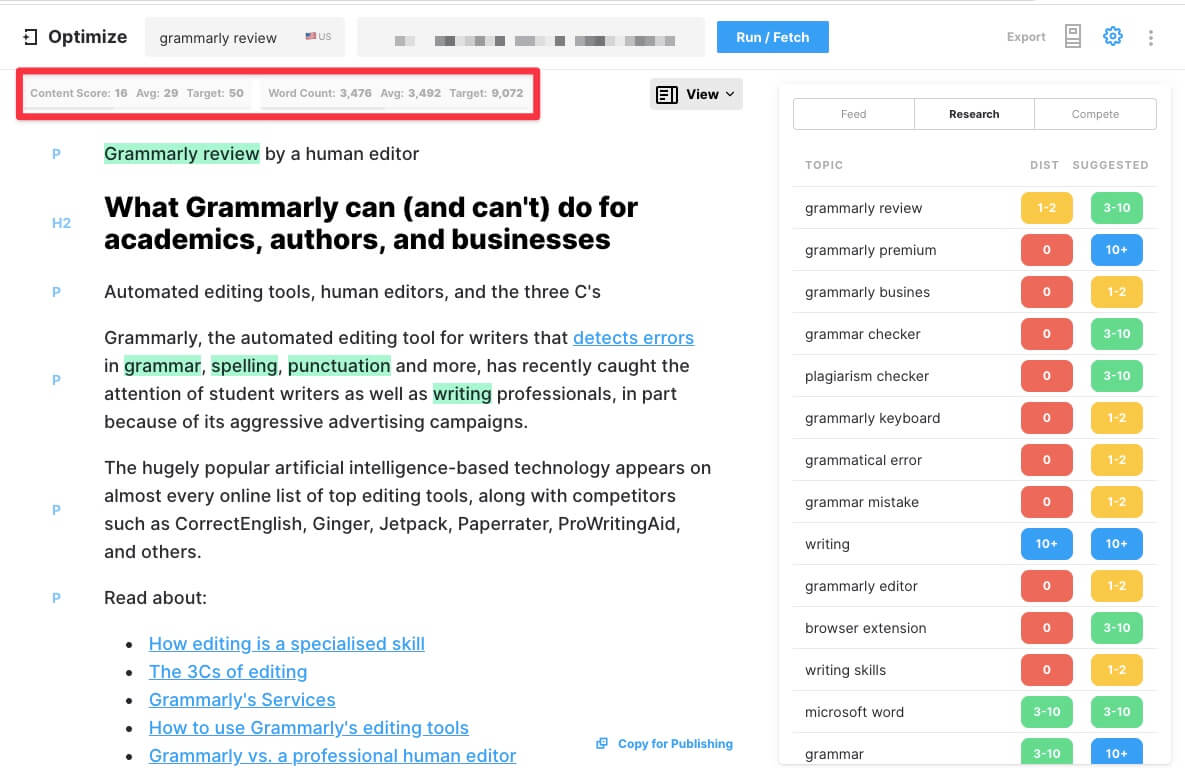
There are a few ways, though, to analyze content quality objectively with quantifiable feedback.
Subject-matter expertise can usually be spotted pretty quickly once you have an eye for it:
The trick, of course, is doing all of those things without the type of overly formal writing that often falls flat online. People’s multi-device multitasking often prevents them from consciously focusing on any one thing for too long.
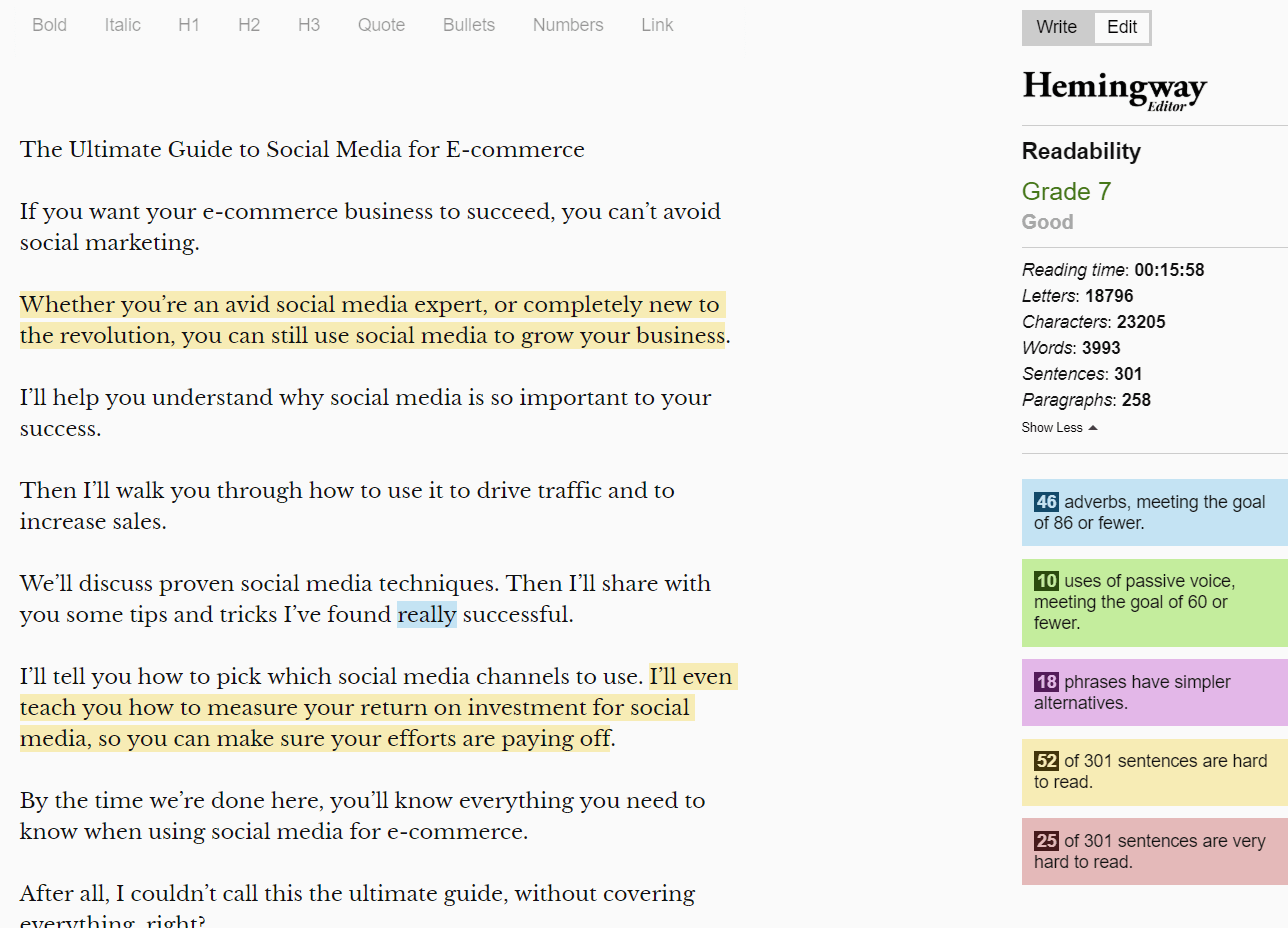
So “quality content” online — regardless of style, employs the Art of Concision.
That’s where Flesch–Kincaid readability tests (included in most writing apps like Grammarly), along with other online editors like the Hemingway App) can help provide instant feedback on your tight-rope walk of (1) writing with subject-matter expertise without (2) being too difficult to read.
The topic of a piece is what you’re writing about.
The angle is your unique point of view or take on that topic.
And the style is how you write the damn thing.
Scaling content properly is impossible without standardized guidelines to help writers understand who they’re writing to and how they should write it.
Sometimes, this is a style guide. Others, it’s simply a research and outline walkthrough. The point is that you can’t just expect writers to understand what you want.
Especially when you (a) haven’t documented it in a clear, objective, (b) provided training in this style or fashion, and then (c) consistently provided feedback with concrete (read: not intangible) examples.
Ideally, your voice and tone should:
If you don’t have multiple concrete examples that illustrate each of those elements, then you probably don’t have a very strong voice or tone just yet.
Listen.
This whole “content marketing” thing isn’t that unique at the end of the day. We’re not all special snowflakes here.
You (or your team) can’t scale content because you (or your team) can’t create systems and process and delegate and manage.
Simple as that. Fix those things, first, before coming back here. Because it’ll constantly be the bottleneck that determines how long (or how high) your glass ceiling rests.
Writers aren’t mind readers. They don’t know what’s in your head. They don’t know what you expect. Unless you help them.
You can tell when tools like Google Analytics have been created by engineers, not marketers.
Log into Google Analytics and look at all the flashy examples that immediately jump out at you:
Once again, all virtually meaningless in a vacuum.
Like the preceding section above, start looking at content marketing analytics on a page-by-page basis.
Take time on page, for instance.
If we’re analyzing a landing page, a shorter time on page is OK. Actually, it might be preferred. You want them to click and convert! Not stick around forever.
But on the other hand, if we’re talking about a looooooooooooooong blog post or article like this one, a ~30-second time on page would be bad!
In other words, there is A LOT of context that you need to use when analyzing “engagement” metrics.
For starters, I’d actually recommend:
Here’s how this works.
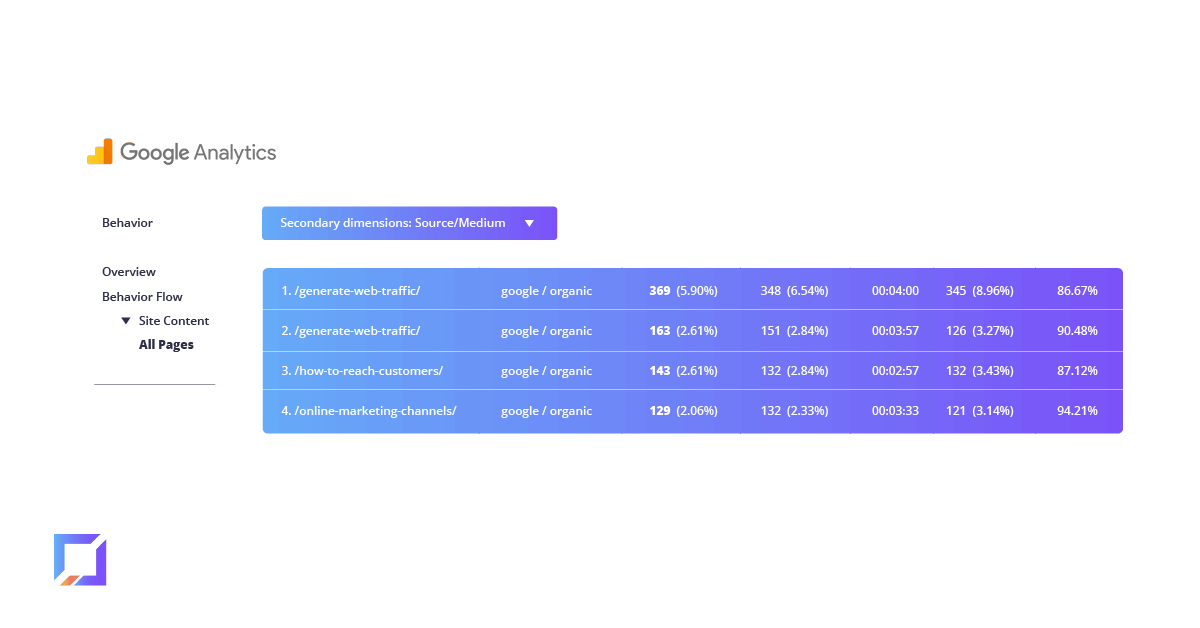
Check out the “Content Drilldown” report from inside Google Analytics (under “Behavior,” go to “Content” and then look for “Content Drilldown”).
Add a “Secondary Dimension” for “Source / Medium.” And you might need to tweak the variables that are showing up to get Time on Page, Bounce Rate, and Exit Rate on the same place.

The slash in the first line (“/”), or visits to the homepage from Google, have a really low average Time on Page… but when you overlay the Bounce Rate and % Exit, it actually looks really good!
The goal of that page is to get people to a different page (or help them login). So I don’t care if Time on Page is super low… as long as the Exit Rate is also low. Which it is.
The content pieces in lines 4-7, meanwhile, have a longer Time on Page (because someone is sitting there reading) but also really high Bounce and Exit Rates to match. That’s not great.
Here’s why.
Bounce rates sound good in theory, but are tricky in practice.
Think back to the last example.
Content pages will ALWAYS have higher bounce rates, relative to website pages, product pages, etc. But too high is not a good thing either.
The trick is to understand how bounce rates are actually defined. And then use additional context like where visitors are coming from, looking at individual pages, and using it together with Exit Rates to better understand what’s actually happening.

This is why sitewide bounce rates are meaningless. What does it actually tell you? Not a whole lot.
BUT, it should be no surprise that your bounce rate is relatively low to your homepage if you understand that most homepage visitors are probably brand aware, and from search, so they’re seeking you out.
Contrast that with the relatively higher bounce rates for content pieces where brand unaware visitors are landing, and it makes complete sense.
Someone just randomly Googled “how to fix a tire,” because they were looking specifically for that one piece of information. They don’t have any idea of who you are. Your content piece solved their problem.
So they’re off to, you know, try and fix their tire!
What you care about, then, isn’t necessarily if they “bounce.” Yes, that’s a problem – usually indicative of a bigger problem that your page doesn’t actually align with search intent.
But the bigger issue to focus on is whether they’re actually leaving your site from that particular page.
Because if they’re leaving your site, in droves, that means you gotta work extra hard to get them back to ultimately purchase something one day.
Which means… you need MOAR content that targets different stages of the funnel. (Think: more commercial pages, calculators, studies or guides, reports, webinars, whatever.)
Which means… you also need retargeting campaigns to remind them that you exist and get them back.
Otherwise, maybe you SHOULD offer “stickier” opt-ins and other micro-conversions (more on that later) to capture some other user data.
The key is to always keep in mind the big picture.
All of this context matters.
And it’s ultimately why a high Exit Rate on one page (1) vs. another (2) isn’t always “good” or “bad” straight away.

There’s a lot of stick, sweaty, shades of grey in all this analysis.
Dwell time is meh.
On the one hand, it IS a thing. It is a nerdy SEO concept that does have some validity. So we should address it.
It essentially helps you answer: do people like what they see when they hit this page? Does it line up with their expectations?
It’s kinda like the accidental bastard child from some naughty ménage à trois between Time on Page, Bounce Rate, and “pogo sticking” – or the time spent on a page after entering before hopping back to look at other search results.
As you can see, there’s some overlap with the other three examples we’ve already discussed here. And it’s also not the most actionable metric, because again, there’s a ton of nuance involved.
A “low” dwell time on my homepage doesn’t mean the homepage is bad. In fact, it’s actually doing it’s job! I want people to hit the homepage and use it as a jumping off point into other pages on my site. So it’s all OK. It’s all going to be OK.
Point is: don’t obsess over made-up concepts.
Do the hard work of researching search intent, actually creating really interesting or engaging content that aligns with your audience’s expectations, make it better and more thorough and more interesting than your competitor’s, and then… just check in every now and then.
Are the pages on your site doing what they’re supposed to be doing?
Moving people from Point A to B? Educating people about a particular subject and introducing your brand to them so you can bring them back a later date when they have a problem you can solve?
If not, tweak.
Otherwise, move on.
Don’t lose sight of the forest through the trees.
Content ain’t ads.
They might share the same digital real estate on each SERP. They might just be a click or two away from each other.
But unfortunately, you can’t judge one like the other.
NOWHERE in the world, other than AdWords, do you see: search -> click -> convert. In seconds. In the blink of an eye.
Notoffline with TV ads or billboards or radio spots or events or magazines or those god-awful park benches the homeless defecate in their sleep on.
And hell, not even anywhere else online, either. Not social media, not Facebook ads, not Reddit, not huge press mentions, and let’s be 100% real – not Bing or whatever other hipster search engines are out there, either.
Nowhere can you find the same scale + purchasing intent + relatively transparent data on dollars to clicks to customers.
So it’s not realistic to measure content performance by the same conversion-heavy metrics.
Yes, content can convert. But no, it doesn’t always happen with the same cold-blooded efficiency as ads. And no, not in the same blink-and-you-can-miss-it, instant ROI, either.
Here’s how to diagnose what’s sabotaging your sales.
Engagement metrics tell you what’s happening on individual pages.
String those together, with the previous page or source someone is coming from, and the next pages they’re moving onto, and you’ve got a “path.”
That’s important because of what we just discussed: sales from content rarely go from landing page to closed deal. Unless…
The more common occurrence happens when someone:
YOUR goal, here, is to first identify what common visitor paths like these are already happening. And then second do everything you can to minimize the friction or bottlenecks to get more people on those same high-converting paths.
More specialized content marketing analytics tools can help for this kind of analysis. It’s especially helpful when any marketer on your team can see how changes in one part of the funnel (like pages or internal links or CTAs) affect things further down (like paying customers).
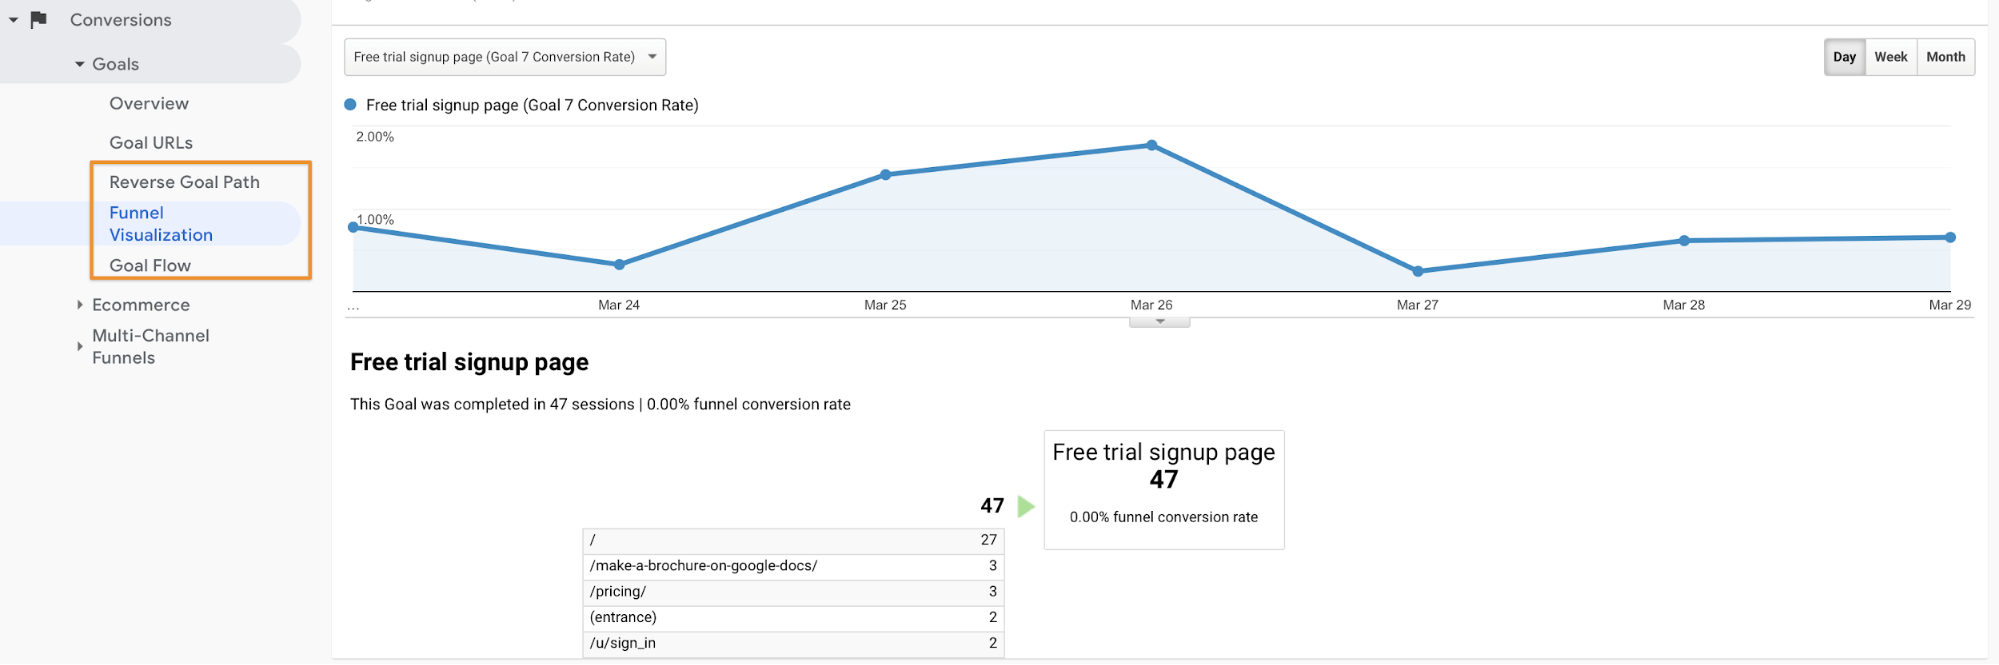
But even Google Analytics has three great reports for this, under “Conversions” and “Goals.” Those three include:
These three will be worth their weight in gold. (Assuming, of course, you’ve done a good job creating goals and properly tagging everything.)
You’ll be able to isolate different micro-conversions (more on that in the next point) and reverse engineer exactly how people are converting on your site. From there, you can drill down to the content across each step of the funnel to systematically make improvements.
Macro-conversions, or sales, customers, and leads, are great.
BUT, as the final step in a long process, they’re hard to drive directly. (Brush up on your Avanish for more digital marketing analytics and marketing ROI gold.)
So. Do you want to move the needle on customers? From content?
Gotta start by upping your micro-game, then, first. Because they’re often the missing link between brand new strangers and loyal brand advocates.
Again: use your visitor paths as highlighted in the last few Google Analytics reports. Spotlight those bottlenecks or speed bumps or potholes.
Then, brainstorm:
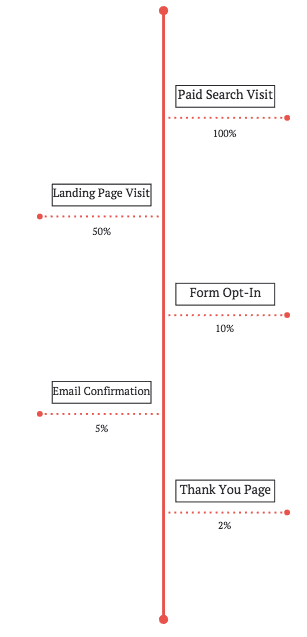
Here’s how this could look.
If you’re a SaaS company, focus on performance-based metrics.
Number of trials is irrelevant here. Instead, how many website visitor to trials are you getting?
Sub-1%? That’s an issue.
(~1%-2% would be ideal, depending on your space, product pricing, sales funnel, credit card vs. none, etc.)
SO, if you’re converting less than 1% of website visits to trials, your problem is probably people (less brand aware people at that) dropping off after entering your site on content-based pages.
For example, go into the Goal Flow, and add a secondary Source / Medium for Google. These are often your unbranded, highest volume people. Where are the huge drop-offs happening in the chain, and how can you address each one to get more people to stick around?

Now.
What can you give them to stick around, other than a free trial?
(Which we’re assuming they’re not yet interested in, because they don’t have the proper problem awareness – otherwise they would have signed up already.)
Free course? Webinar? Pricing sheet? Podcast? Retargeting pixel? Something? Anything? Buehller?
A little of something is better than a lot of nothing.
So get what you can from them while they’re here and live to fight another day.
Yes.
You can sell directly from content.
Yet, it’s not easy.
For relatively inexpensive products (say a hundred bucks or less), it’s easier. This transactional pricing lends itself easily to incorporating direct product mentions.
Think:
On both levels, the hard part is (1) actually ranking for difficult terms, (2) appearing credible and trustworthy, and (3) making the sales pitch compelling (e.g. getting the reader’s emotional lizard brain involved so it’s not just a rational purchase for something they don’t need).
BUT.
If you’re selling complex, technical, or expensive items, it’s incredibly difficult.
THIS is where you need to get creative.
You often have to use micro-conversions from the last step to break a long, complex sales process down into a series of small commitments.
Then, you use some lower-priced product or service variation (via product splintering and tripwires) to let people get a taste test of what they’re buying.
And guess what?
These techniques aren’t some scammy, manipulative, infomarketing bullshit.
In fact, like the best marketing ideas, they’ve been around for decades and decades. This poster, for example, first showed up in the 1960s:

Enough to make Frank Kern blush.
Get someone to spend that first dollar, and you’ve racked the shotgun.
You know who’s got dough, who knows what’s what, and who’s motivated enough to actually give a damn about affecting change.
Because the #1 thing stopping you from selling more isn’t your competition. It’s inertia. Selling faster is more important than selling more.
Alright, let’s get ready to rap this unnecessarily long post up.
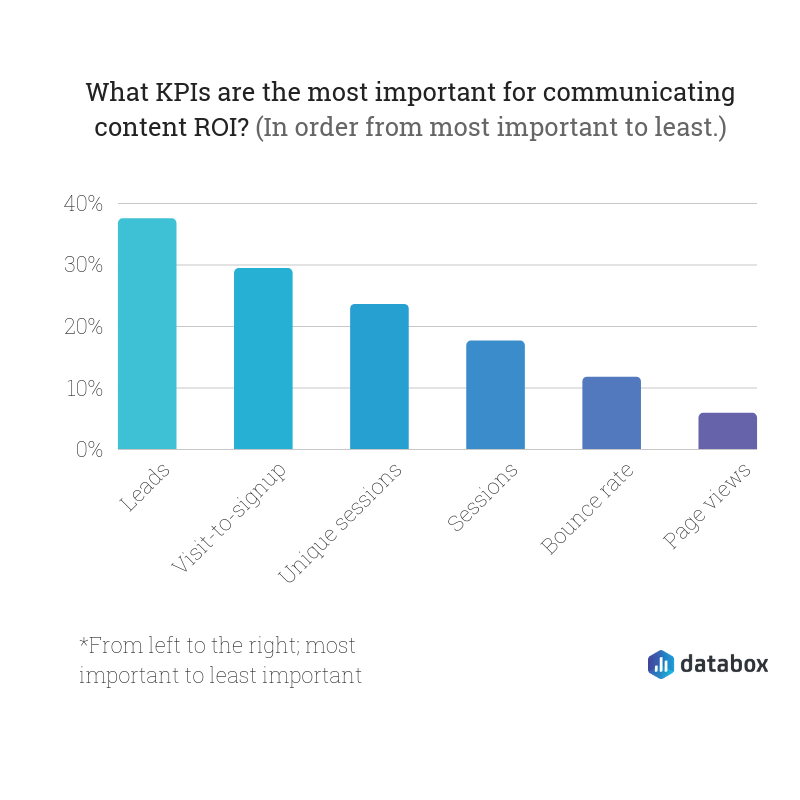
But first, let’s discuss which of these content marketing analytics or metrics you should be tracking. And more importantly – when.
All of these content marketing metrics and KPIs should be used holistically. They all tell part of the story. You job, when regularly reviewing, is to use them together to get a complete picture and make better decisions.
Here’s how to do that from a content perspective.
Ha!
Just kidding.
You shouldn’t check any of these daily.
You have more important things to do in life.
You should be publishing or promoting or focusing on output. Or, I dunno, spending more time with your significant other and kids so they don’t resent you for wasting so many hours in front of a screen.
Success comes doing simple things over the long term. Not some fantasy, unicorn, silver bullet bullshit [insert marketing guru here] claims.
The hard part is the execution, not the analysis.
So on a daily basis you should be actually getting shit done.
Not obsessing about metrics or KPIs or rankings or whatever that will naturally fluctuate over the course of a few hours.
The only exception here would be the day-to-day items you need for decision making, like topical authority if you’re doing keyword research or page-level optimization if you’re about to publish a new piece.
Take a look at your leading indicators each week to see which way things are trending, and how to either (a) accelerate those things or (b) reverse course.
For example:
The idea here is to use weekly data to better drive your day-to-day decision making.
So if you’re watching a keyword that hasn’t started ranking well yet, can you revisit the “balance scorecard” to identify the potential reason? Maybe it’s better page optimization, or drive a few more links?
If it’s ranking well already? Maybe double check the competition to see if anything has changed around it (more big sites, longer content, content with videos, etc). Can you build a “competitive moat” around it by incorporating these things before your competition does? Otherwise, hold steady.
It’d also be appropriate to keep an eye on specific content marketing analytics that are a high priority project.
For instance, if you’ve been focusing on increasing website visits to trials this month, then of course, be more thorough in micro-managing your micro-conversions.
Checking your Funnel Visualization report inside Google Analytics on a week-to-week basis will quickly let you know if those little changes you made this week are helping or hurting. Or if it’s simply too early to tell.
(Which it probably well be, if you consider full-funnel analysis where changes in visits to trial, like removing a credit card step, might help or hurt conversions down the funnel, like less conversions from trials to paying customers.)
Keyword rankings might fluctuate on a day-to-day basis.
Monday your position is 1. By Wednesday, down to 4. Friday back up to 2. Before settling in at 1 again by Sunday.
Sames goes for almost every other metric on this list.
That’s why even weekly fluctuations aren’t always helpful.
But month-to-month is where things get interesting. You know have more patterns to match and trends to analyze.
Raw data in all marketing analytics is only helpful in two ways:
Point is – all data is HIGHLY relative. Your specific context means everything.
Again, I’d start with input-based metrics here to review past performance:
Next, how have these PAST inputs been performing? ‘Cause this month’s content performance is the result of the previous six month’s work – not whatever you published this month.
Quarterly (and longer-term), you should double down on the monthly analysis you just performed.
But then you should also think more medium to long-term, too.
The top performing ~20% (of traffic and/or conversions) should be the minimum. Yes, you can go longer and do more. But this comes down to resource allocation. You’re looking for specific things to add or update across each URL, so if you don’t have the bandwidth to do more, just focus on the Pareto Principle and the top ~20% of content on your site that makes up 80% of the results.
So if you’re focusing on the top URLs for traffic, then revisit your KPI list above and rank each page across all eight components (keywords, topical authority, internal links, page-level optimization, referring domain quantity, referring domain quality, expertise and concision, and voice or tone).
Then, call out what’s good vs. average. vs. bad and where each URL can improve.

Where is your product or service evolving in the medium to long-term?
Where are your audience preferences now? Are there any new trends relevant to them?
OR, is your product evolving in a way that will open up a brand new audience segment or vertical?
Think broader to monetization here, too. For instance, if your audience isn’t changing or opening up necessarily, but you want to drive conversions with a higher average revenue per user (ARPU), then that will affect the type of content and style you choose!
Enterprise clients and customers won’t care about saving a buck here or there, or other DIY-oriented solutions. They need speed and convenience.
So all of a sudden, keywords targeting “troubleshooting” and more will give way to new ones in adjacent spaces that target their complex issues.
Now, for the fun part.
HOW are you actually going to get existing content updated or new content created?!
Who, specifically, is gonna do it?
Here’s what to consider over the next quarter:
Unfortunately, not everyone has HubSpot’s content budget. Or resources at our beck and call.
So we need to make sacrifices. Maybe we can’t focus on ten content types at any one time. Maybe we can’t prioritize traffic and revenue at the same time.
Resource allocation over this quarter, half-year, or full year then needs to often drive the expectations for any of the actual content auditing and improvement or new content creation.
Content marketing analytics are a necessary evil.
Yes, you need to watch and monitor and evaluate them.
But no, you don’t need to live and die by them, either.
That’s because long-term success often comes from a blend. There’s no one thing that’s sabotaging your success. And by the same token, there’s no one thing that’s going to significantly move the needle, either.
Instead, you need all of these content marketing metrics to work together.
That’s why success is difficult and rare.
It’s not that you don’t know these concepts or look at these KPIs from time to time.
It’s that you’re not doing enough to consistently improve all of them across the board over the months and years it takes for your content ROI to explode.