

It can be difficult to illustrate milestones or showcase how something changed over time if you don’t know how to make a timeline in Google Docs. It’s an essential visual component, yet one many users seem to struggle with.
There’s no native support for this type of chart or image. So coming up with one takes time and creativity, or at the very least, in-depth knowledge of how add-ons work. If you want to avoid using a basic spreadsheet, you need to know some timeline creation methods.
This article will guide you through the process of drawing one yourself and finding editable timeline charts that you can customize to fit your project timeline and data.
Effortlessly export your Google Docs to WordPress with just 1-click.
Get Started TodayA timeline offers a visual presentation of events in a chronological sequence. It’s often represented by a horizontal line that has the purpose of showcasing temporal relationships between events.
A timeline can be handmade or improvised in a Google doc from a line chart, a timeline template, or any other chart or graph that can show a chronological sequence of events.
While used in documents too, it’s more commonly found in a Google sheet or Google slide presentation, yet it always serves the same purpose.
Not all timelines are created equal. In practice, we can find them in many forms and styles, each serving a different purpose.
While the essence of a timeline stays intact (i.e., showcasing events in chronological order), each type helps you present ideas in a different way.
We can separate timeline types by category.
Knowing how to make a timeline in Google Docs can be very important if you’re creating official presentations. It can help people visualize how a company has progressed since its birth.
Timelines are also used to analyze the performance of stocks or to create a trading plan.
A timeline is an essential component of a chart whenever you need a periodic assessment or comparison over time. You can do this for everything from performance to value, to the number of products sold, losses, and pretty much anything else.
Last but not least, you can also use a timeline to establish a specific chronology in a research paper too, or to highlight key points in an article.
These timelines can also be important when using a presentation maker, as they help the audience visualize the sequence of events, understand the relationships between different points, and follow the narrative more easily.
As useful as it can be, creating a timeline in Google Docs isn’t exactly practical. The basic approach is to create your own timeline template and make use of the Google drawing tool.
A timeline doesn’t have to be a complex drawing, as long as the information is clearly separated and arranged in chronological order. Here’s how you can make a timeline in Google Docs.
Unfortunately, there’s no official free Google Docs template that will help you create a timeline in seconds.
You could potentially adapt an MS Word template, but you’ll have to download it from a third-party website — maybe even pay for it. None of the templates we found stood out enough to merit highlighting them here and recommend paying for them.
The good news is that you can quite quickly create a timeline from scratch by using the built-in drawing tool in Google Docs.
You can also use free add-ons to access templates and editing tools and insert timelines into your documents.
Note: If you’re willing to use another free Google tool like Google Slides, there are templates you can use. We cover this approach in the dedicated Slides section of this post.
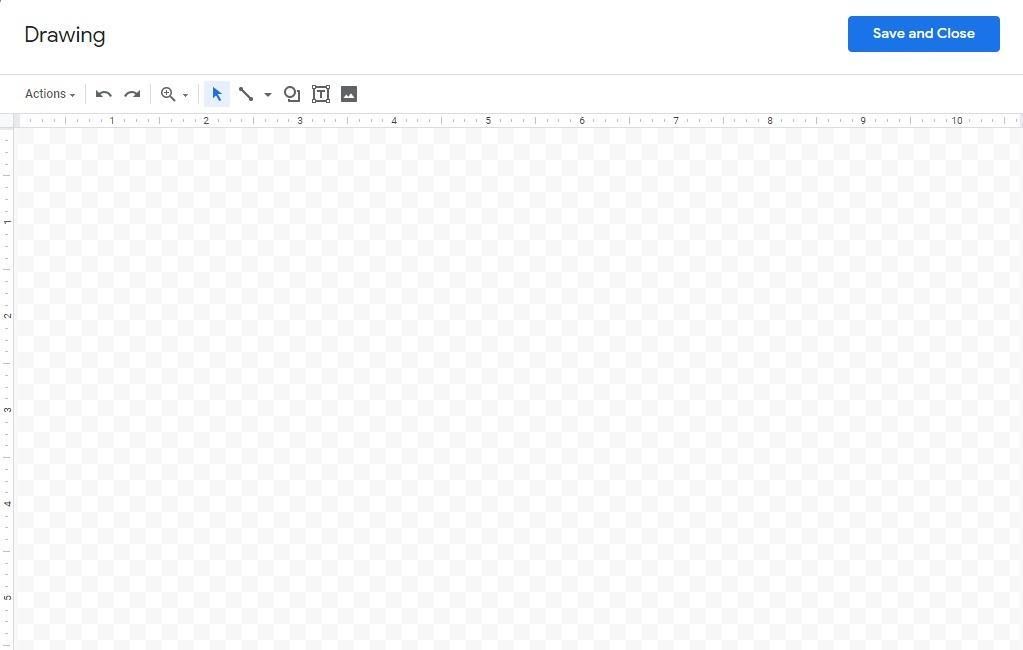
Open a new document and go to the ‘Insert’ tool. From there, hover the ‘Drawing’ option and click on the ‘+ New’ option.

Doing this will bring up the drawing tool interface.
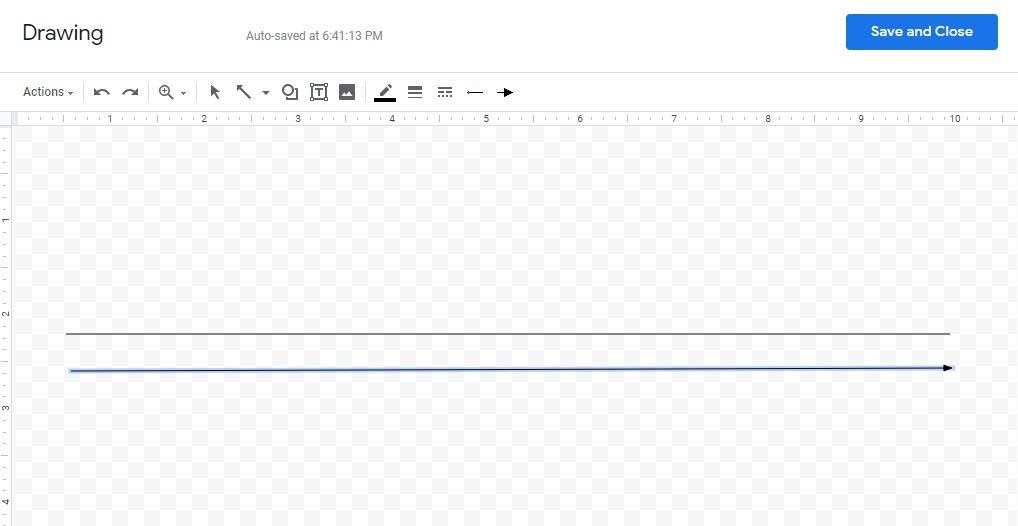
To keep things simple, select the ‘Line’ tool from the menu and drag a straight line from left to right. Hold down the shift key while dragging the line, and it’ll autocorrect to a flat plane.
Instead of a normal line, you can use an arrow. It’ll further accentuate the correct order of events.
Now, create a series of vertical lines starting with the main timeline in order to highlight specific events. Create a text box for each new vertical line from the text-box tool. Copy and paste vertical lines to finish faster. Add text boxes under each vertical line to indicate the year.
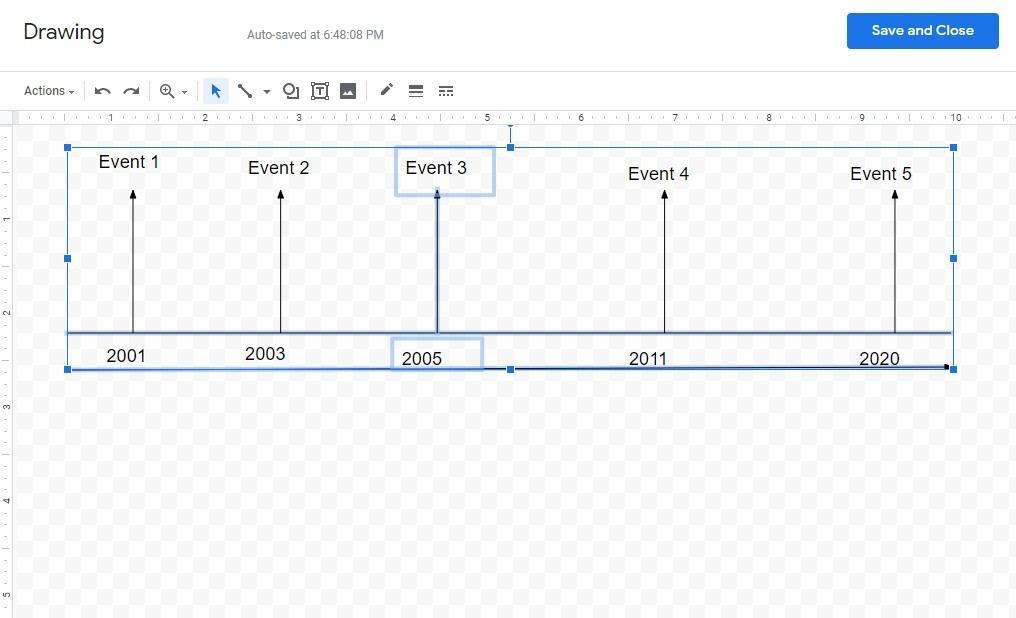
If you want to space the events and years evenly, you can copy and paste them in pairs, then fours, and so on.
After you save and close, the timeline should look something like this in your new document.
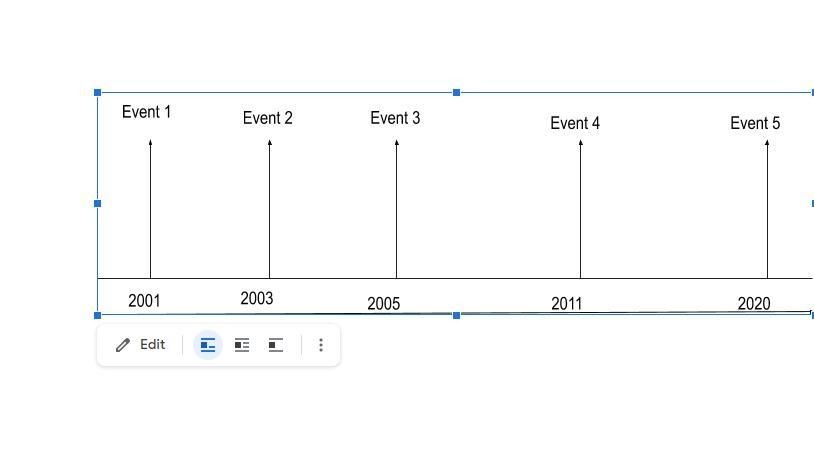
As you can see, it’s nothing too special. But it’s effective, and you can edit it to your liking.
If you have a tablet and some free-hand drawing skills, you can spice things up. If not, you’re probably better off using a different method.
Related: How to Use a Calendar Template in Google Docs
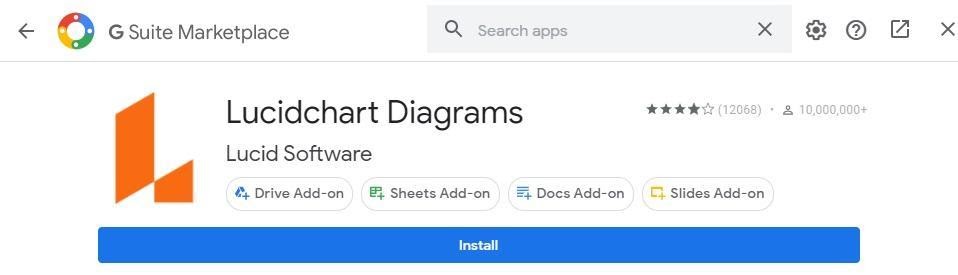
If you don’t want to learn how to make a timeline in Google Docs by hand, you don’t have to. You can use an existing template as long as you use the right add-on. The most popular option for creating a chart or diagram of any kind is Lucidchart.
You can get this add-on from the G Suite Marketplace. (Note that the Add-On is free, but you need a LucidChart account to be able to use it. There’s a basic free plan, but you do need to sign up with your email to access it.)
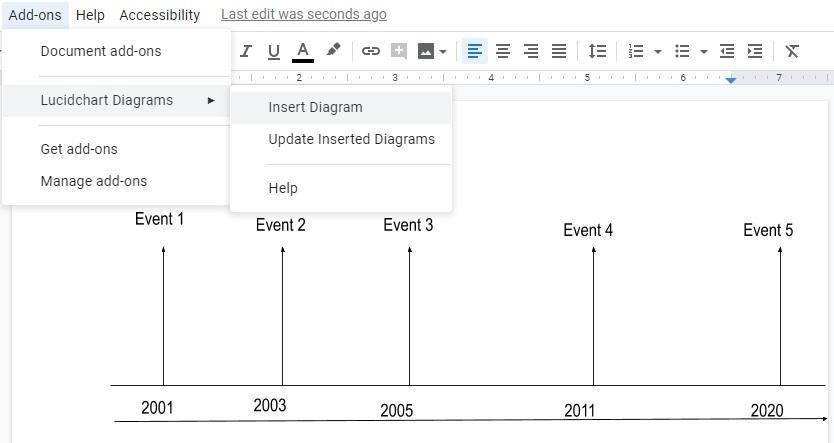
To use the add-on, click on the ‘Add-ons’ button in the toolbar. Once installed, the Lucidchart Diagrams app will appear in the list. Select ‘Insert Diagram’ to get started with your new timeline chart.
Click on the big orange Plus icon on the Lucidchart Diagram side menu. Some charts online are only available to premium users. However, there are plenty of timeline templates that you can use to make your own version.
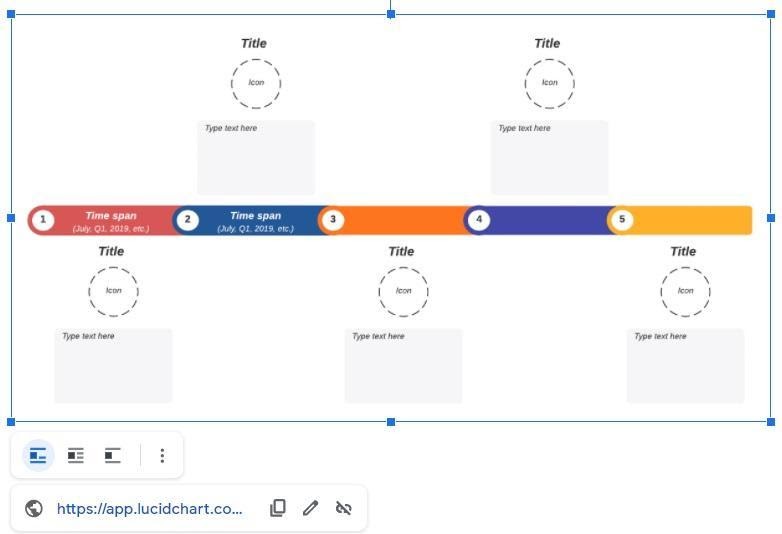
The only downside is that you start with no charts in your folder. This means that you have to log into the Lucid app, create some timeline charts based on the available templates, edit them, save them, and then share them to your Google Account for use in the Google document.
That said, they do look a lot more professional and take less time than drawing them by hand.
But, because you can’t actively edit the chart inside the doc, the experience is more like using a third-party tool and copying and pasting the chart into the document than creating a new timeline within Google Docs.
At that point, you may as well take advantage of other free alternatives to create a visually appealing timeline.
For example, you can use other free Google Workspace tools like Sheets or Slides, taking advantage of Google Sheets integration for a more dynamic timeline experience.
We’ll come right out and say it. Google Docs isn’t the best tool to create a timeline. It’s too limited — especially if you want to create one of the more visually engaging timeline types.
If you’re looking for alternatives, here are some ideas:
Google Sheets gives you a timeline designed for projects with dates and a change in quantity over time.
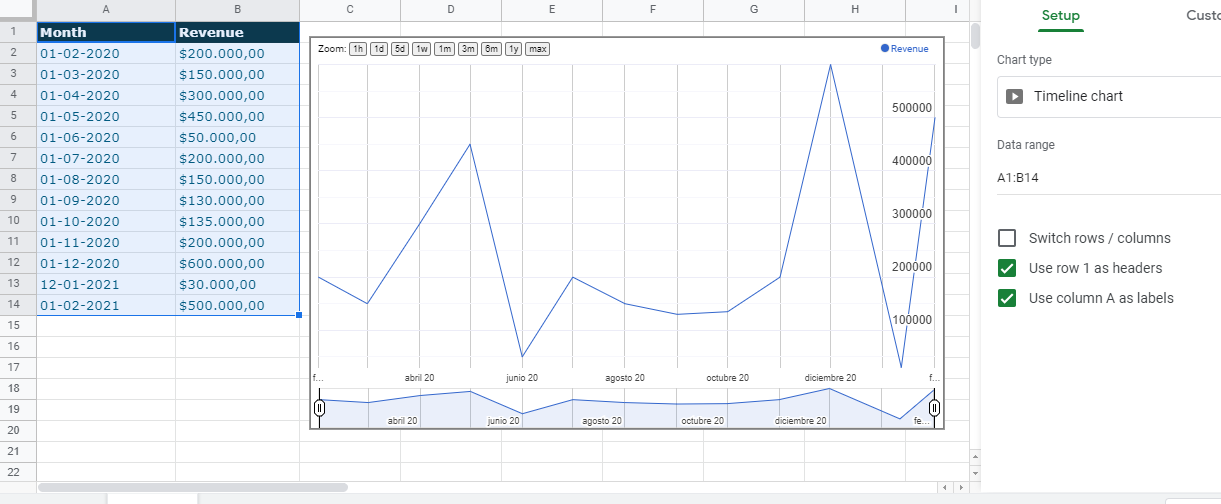
For example, let’s say you want to create a timeline to measure the growth of your business over the last year.
First, you should create two columns to insert your data:

Then, select both columns and head over to “Insert chart.”
By default, the Google spreadsheet will display your data in the form of a bar chart. To change the format, simply double-click the chart and go to “Chart type.” Then, scroll down to the bottom and select “Timeline.”
You’ll see something like this:
To clean this timeline a bit, we suggest you make the following changes:
First, select your timeline and go to the “Customize” section. There, change line thickness from 1 to 3. Also, add some opacity to fill the area beneath the timeline.
The aftermath will look like this:
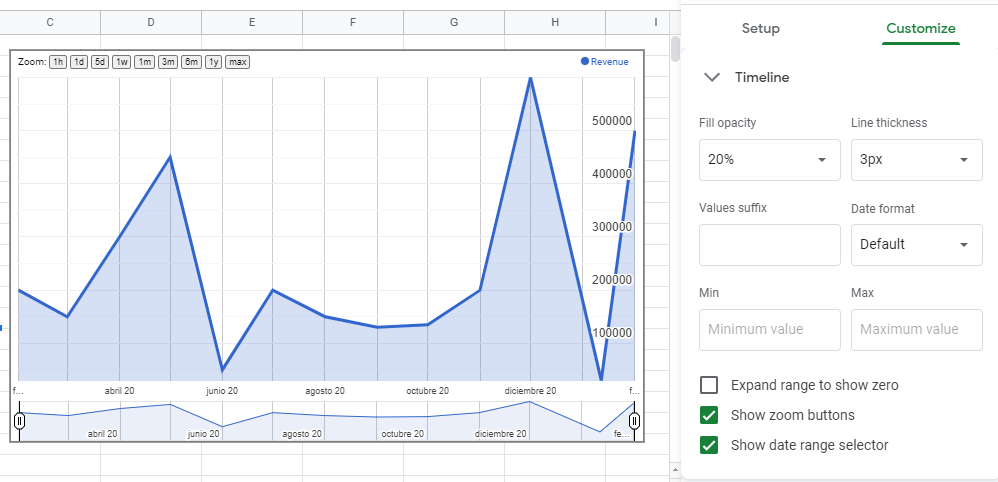
This interactive timeline is pretty helpful to understand relationships between dates and numbers.
When you head over a particular value, you’ll notice Google Sheets highlights that particular value as well as the respective amount.
Of course, this is a simple example as we used a single variable, but you can use as many as you want.
With custom templates, you can also easily create a complex project timeline like a Gantt chart in Google Sheets.
There are two different ways you can design a timeline in Google Slides. The first approach is to insert a timeline diagram into your document. The second is to use a dedicated timeline template to make your whole presentation into a timeline.
The first way is pretty much like the process used in Google Sheets.
Simply head over the “Insert” menu and select the “Diagram” option. You’ll see many different types of diagrams. Just scroll down until you see one called “Timeline.”
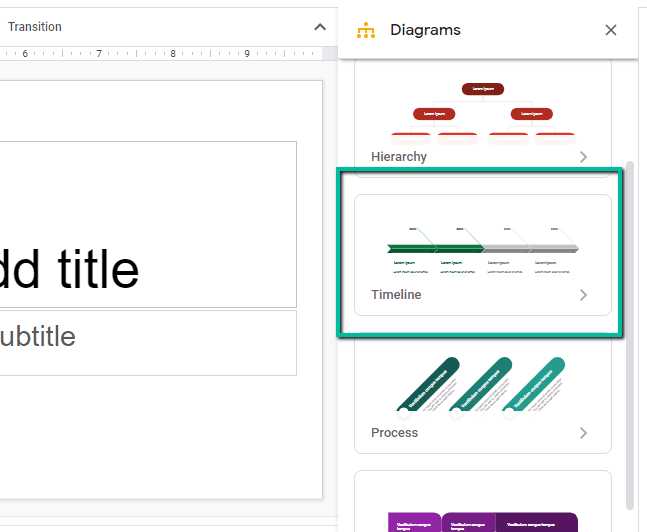
Once you select that option, select the style and feel of your timeline. You can change dates and colors to adapt the timeline to your needs.
When you’re done with editing, just click “Insert.”
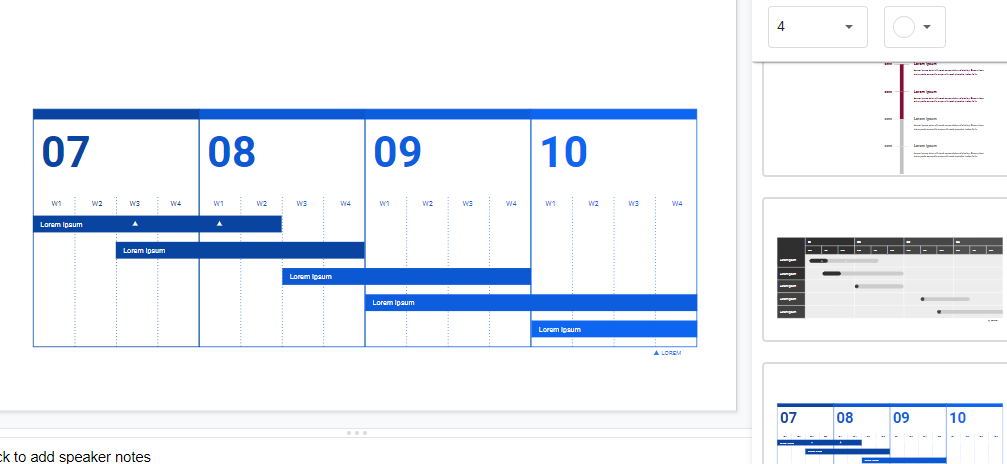
Now all there’s left is to edit the text and start adding your information.
That’s pretty much the thick of it.
Creating a timeline in Google Slides with a template:
Next up, let’s take a look at how we can use a Google Slides template to create a visual timeline in seconds.
Again, there’s no official Google timeline template for Google Slides. But there are plenty of good, free, no-sign-up required options out there.
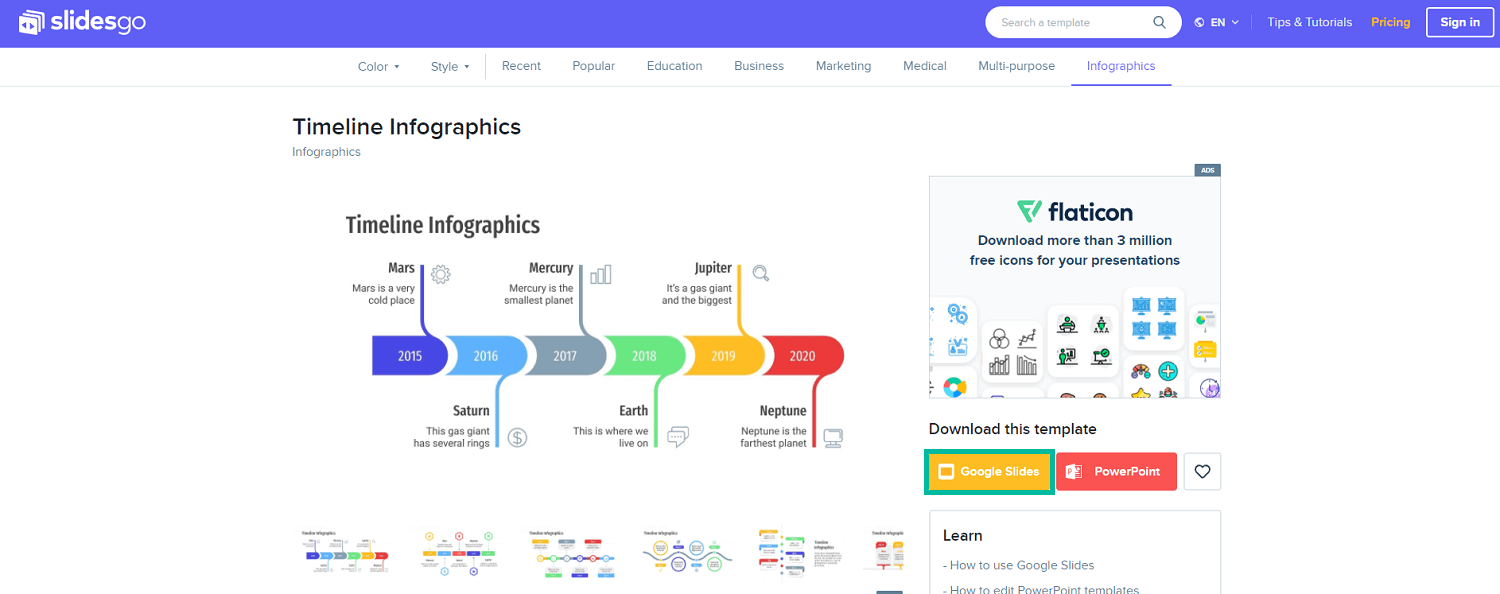
You can, for example, use a free Google Slides theme marketplace like Slidesgo. Simply search for “timeline,” filter the results by free, and choose the option you want.
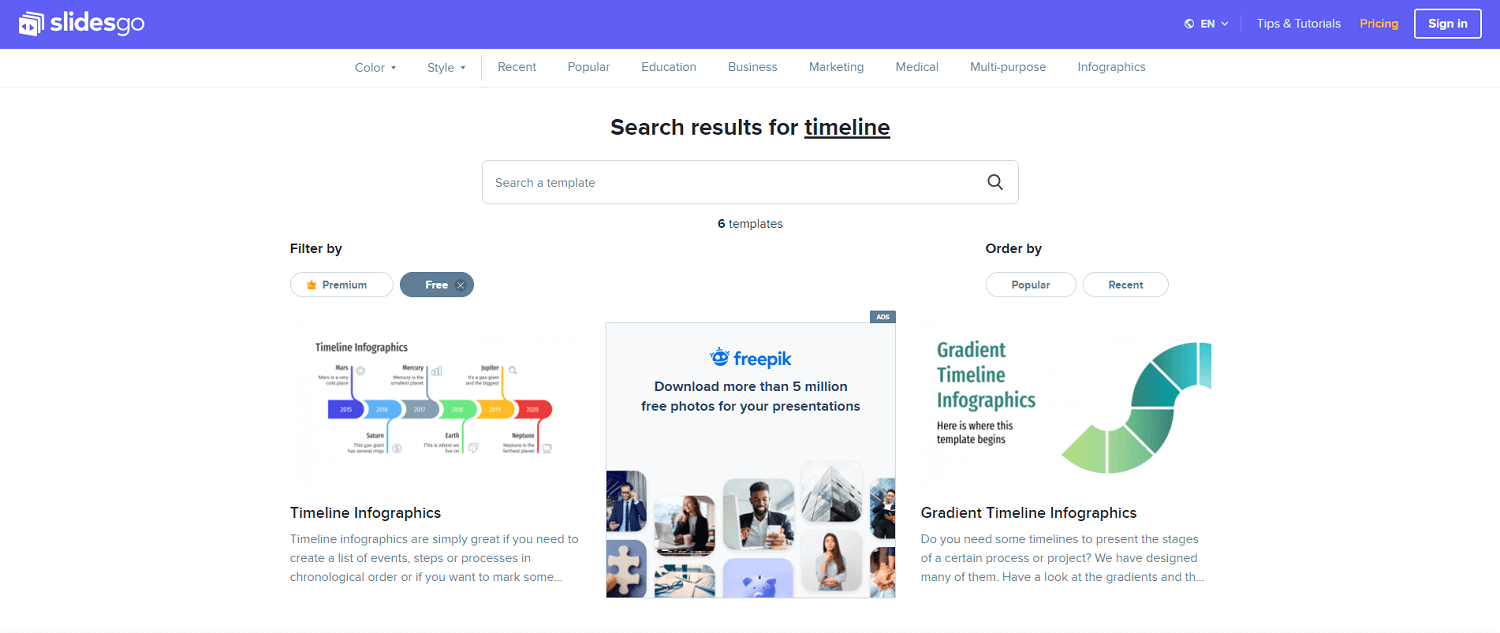
From there, you can easily “download” it as a Google Slides theme by automatically making a copy.
This will prompt a dialog box where Slides asks you if you want to copy the document. Confirm it, and your timeline is ready for fine-tuning.

This particular template has a wide range of design variations, giving you a lot of creative freedom over the result.
You can easily export the final result as an image. It’s also possible to take a screenshot and include it in a Google Docs document.
Although it takes some time to create an accurate and aesthetically pleasing timeline in a Google document, at least now you know how to do it. The method you choose to approach the creation process depends on your budget, time, and preferences.
But remember that the app has serious drawing tool limitations; usually, your best bet is to use a third-party add-on or another tool completely to create the timeline.
The majority of these tools let individuals create, save, and export timelines for free.